Herring Scrap 45: Mapping the Bering Sea Trawl Footprint
Today I saw a new video from Jonathan Kreiss-Tomkins' campaign to become the Governor of Alaska; he's traveled more miles surely than any candidate before him, and the video documents a multimodal journey through parts of rural Alaska that most don't take the time for. Here it is:
In the video, JKT drops in to Alaska Native communities along 450 miles of the Yukon River, and you get the sense that he's hearing a lot of concern about a Yukon River that has been becoming empty of salmon in recent years. One of the conclusions that people are reaching is that the salmon are disappearing from the rivers because of bycatch in the massive Eastern Bering Sea trawl fisheries for Pacific cod and walleye pollock. Hearing their worry in this unusually excellent campaign video motivated me to do something I've meant to do for a while – to go into Global Fishing Watch and make heat maps of the coverage of trawl fishing activity in Alaska for the last several years, and share them here and on a Facebook group opposing the trawl fishery so that the trawl fishery's total occupation of the 50-100m shelf of the Eastern Bering Sea can be more visible amidst plenty industry disinformation.
I'll get to that in just a moment, but first a very basic primer: these boats and their nets look something like this diagram, which shows up in North Pacific Fisheries Management Council materials (I snagged this image from a presentation by the Council's research staff at the February 2024 NPFMC meeting):
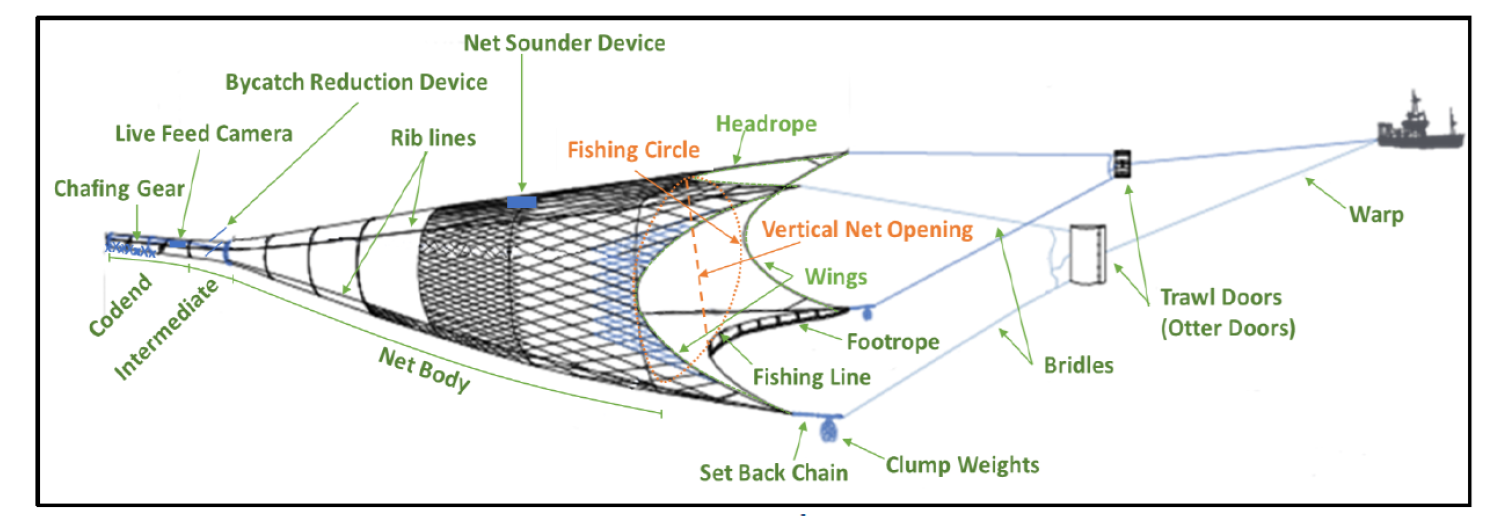
These nets are massive, and they've grown. According to that same NPFMC presentation, by 2012 the forward dimensions of those nets had grown as large as 210 feet wide by 180 feet vertical. Trawlers set up in an area and they pull that big mouth back and forth until they think the gettings would be better elsewhere and move on. They pull up a mess a creatures targeted and otherwise, as well as chunks of seafloor, and they discard a whole lot of it. Gobble gobble. It's been a known bad way to fish for hundreds of years; Callum Roberts did a fabulous job of documenting this in his very good fish book An Unnatural History of The Sea, and it got the David Attenborough filmic treatment in Ocean; here, I'll cue up the trawl section for you:
Even though the Alaska fishery is labeled a mid-water trawl fishery, it has been established that the trawl gear contacts bottom much more often than that label would suggest.
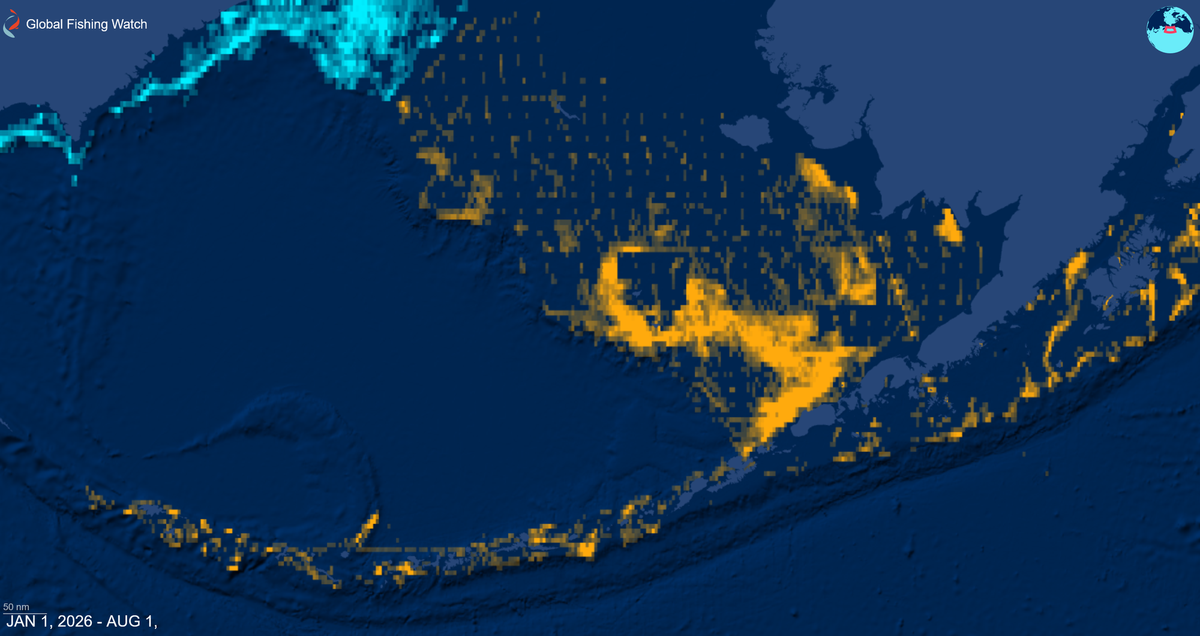
With that all said, let me get to my task here. I used the ever-fabulous Global Fishing Watch resource to identify dozens of American trawl vessels operating in the cod and pollock fisheries of the Eastern Bering Sea, and to visualize their footprint over the last several years. For the sake of illustrating the total wall of trawl in the North Pacific / Bering Sea as a whole, I did a less thorough version of the same for Russian trawl operations.
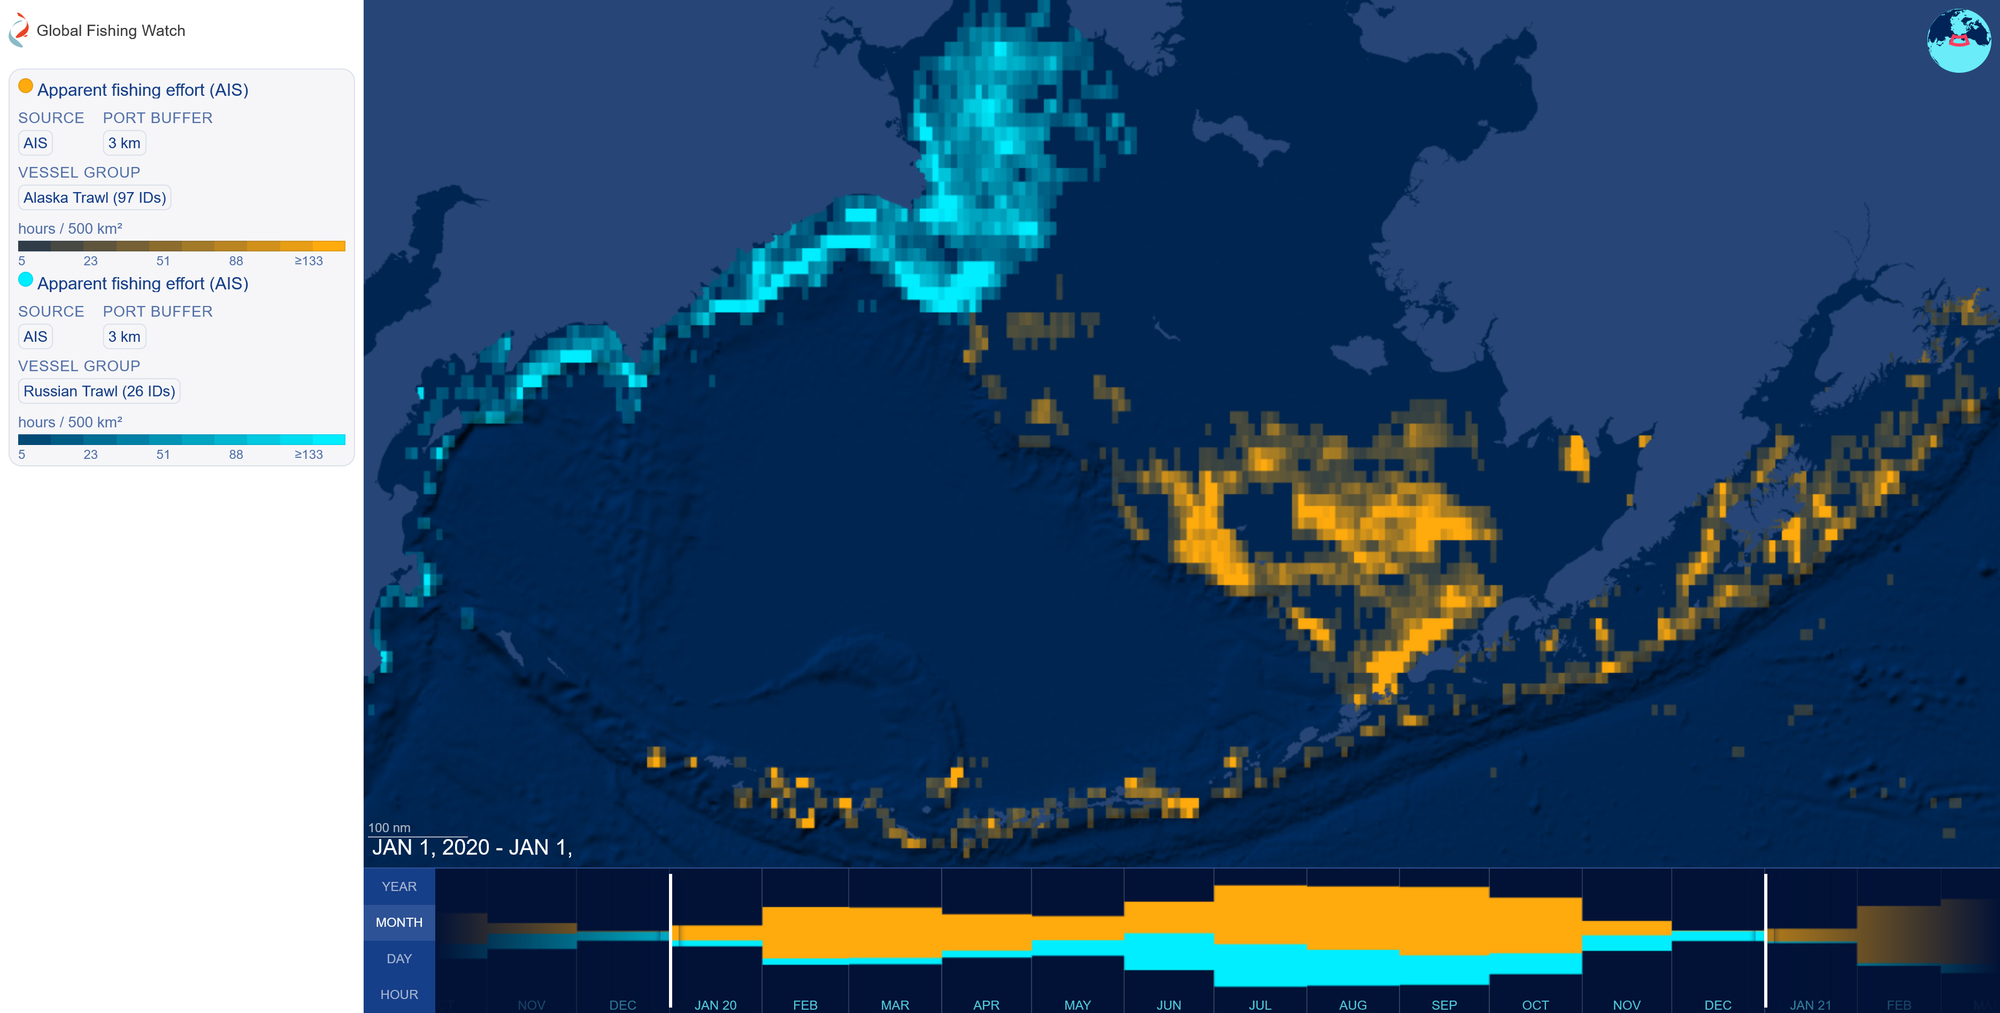
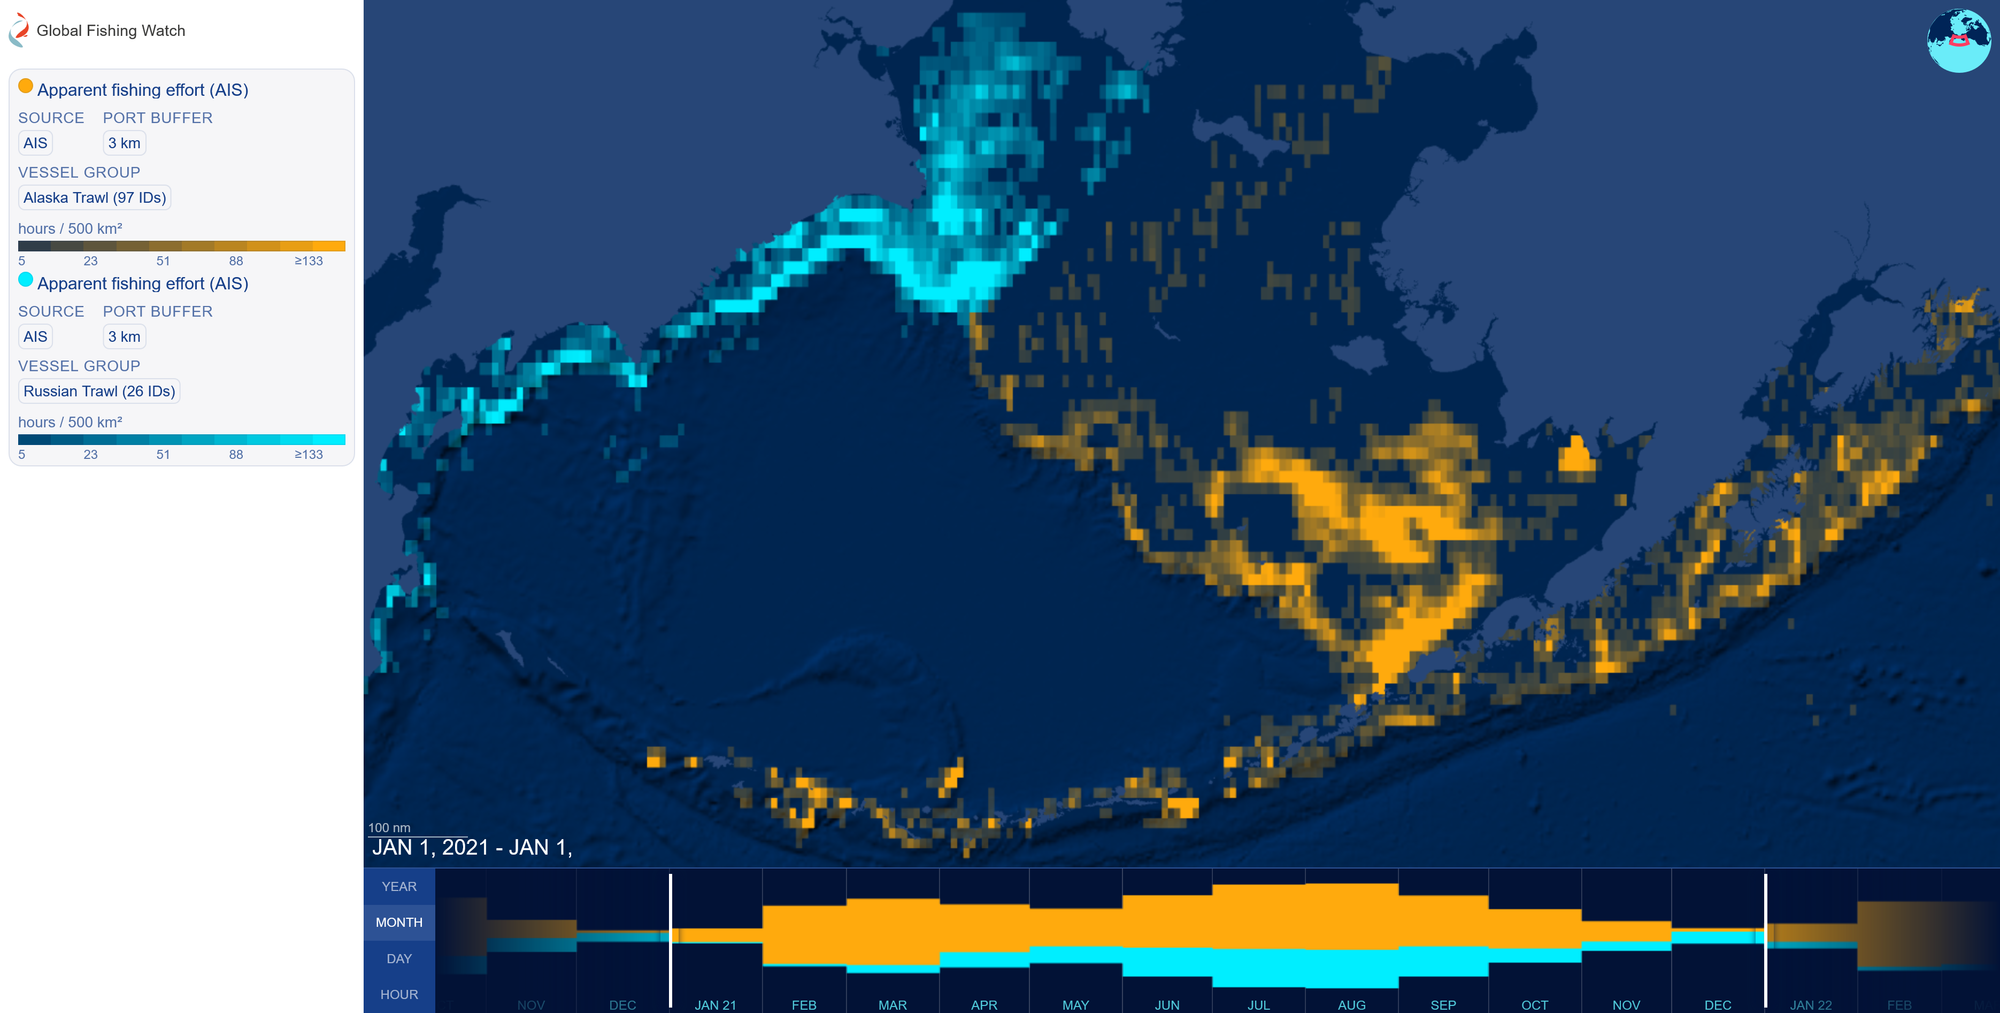
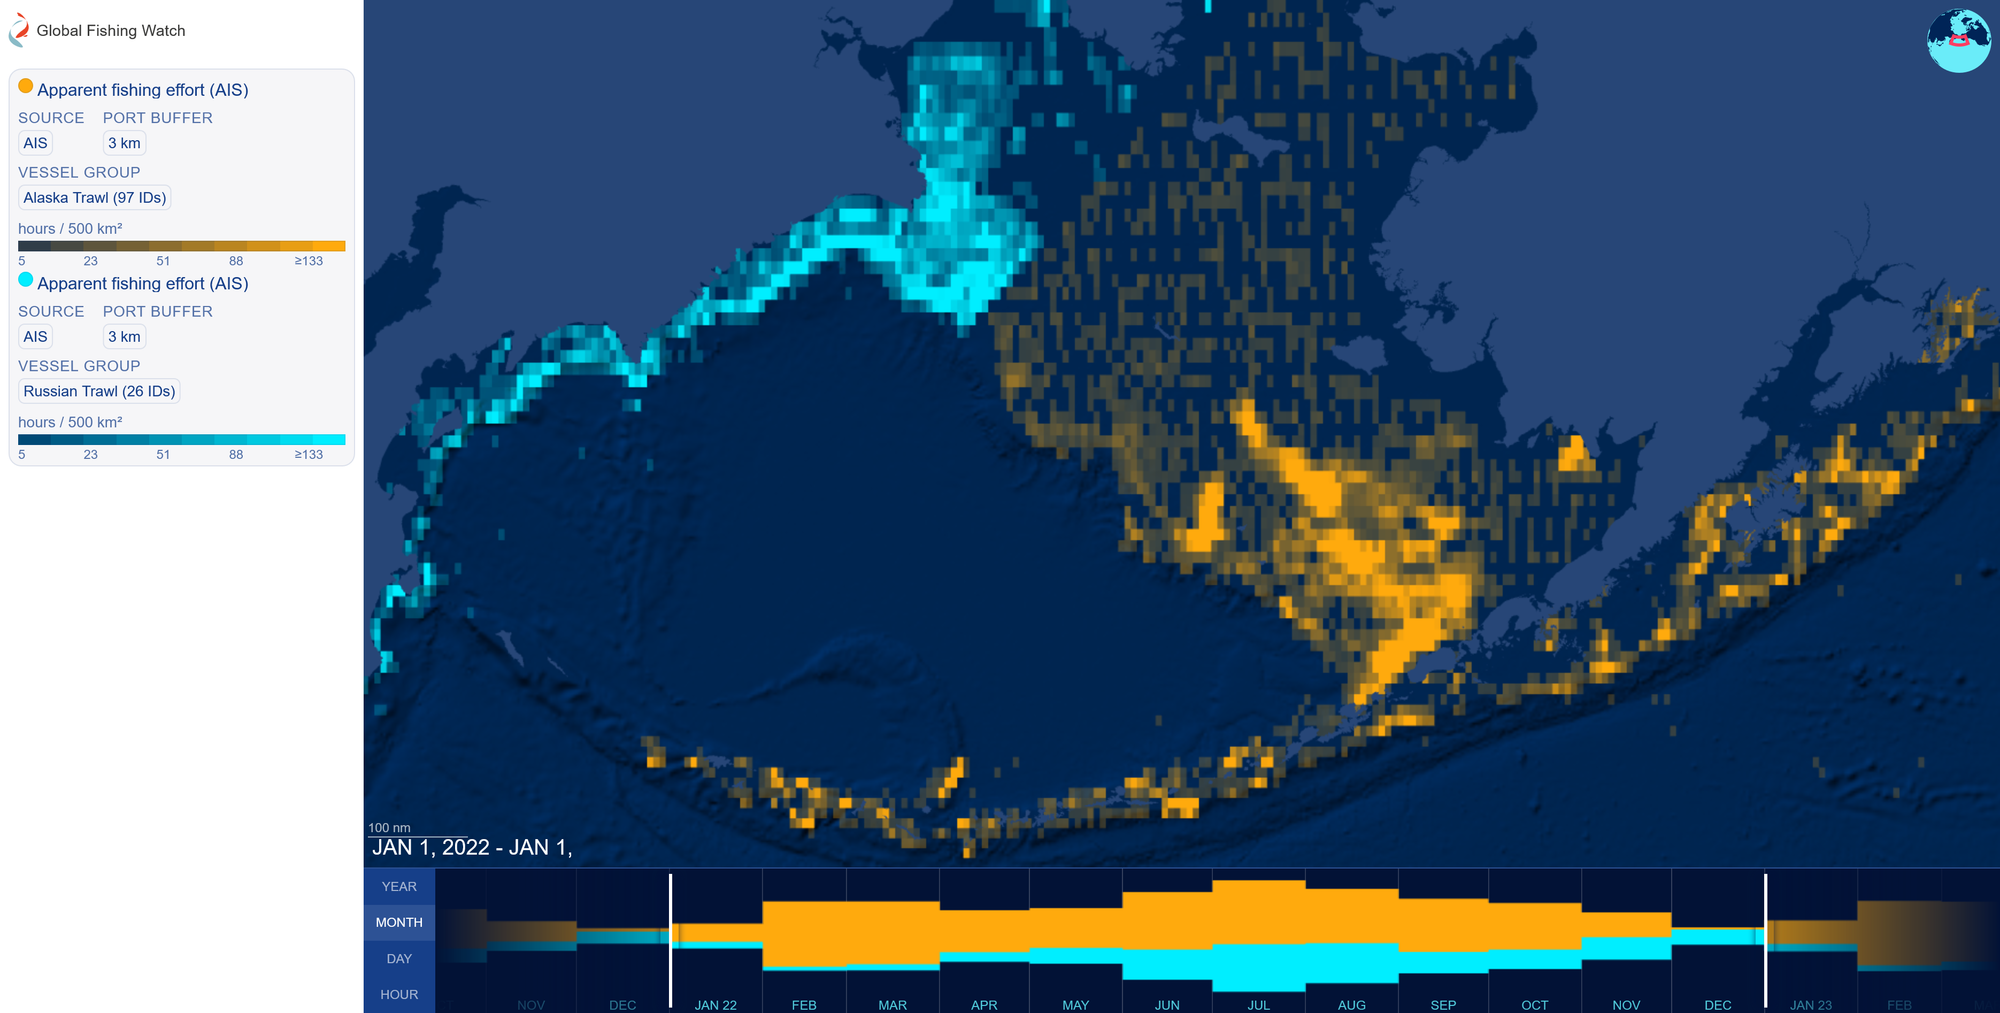
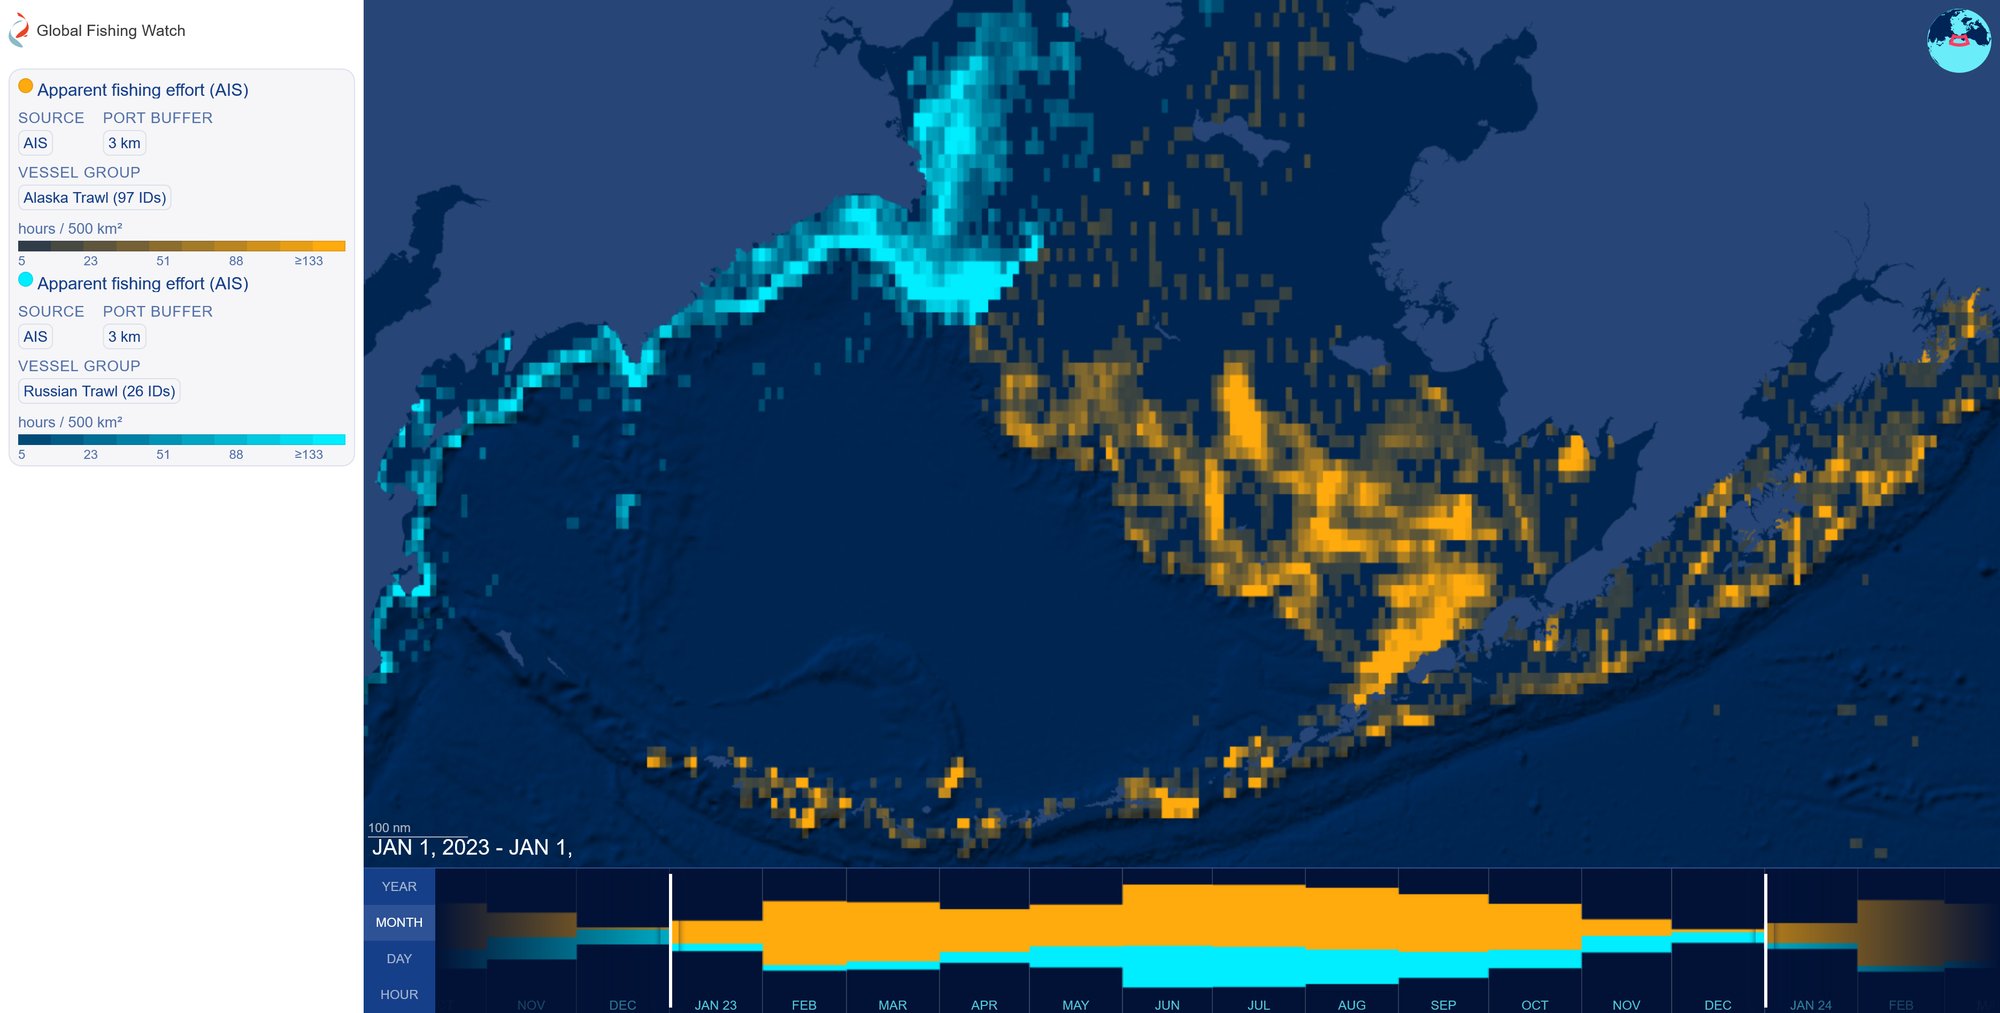
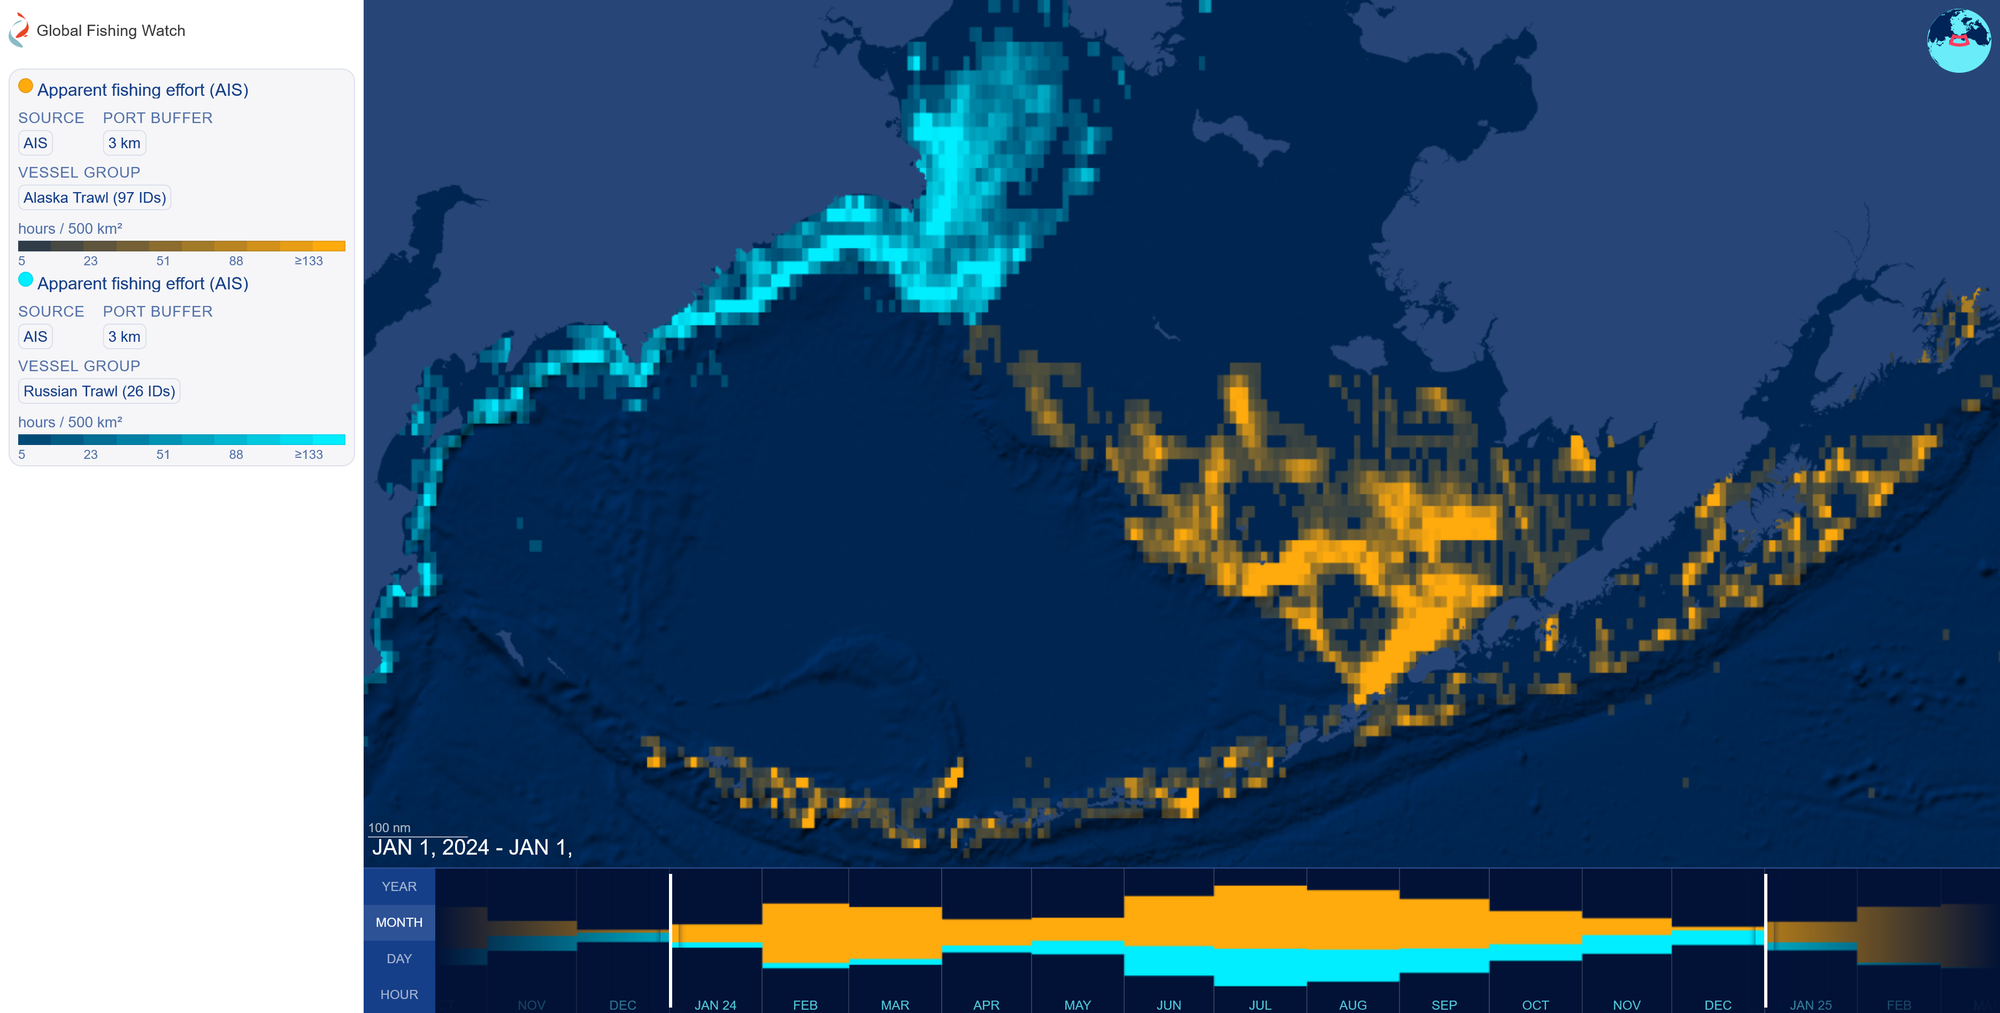
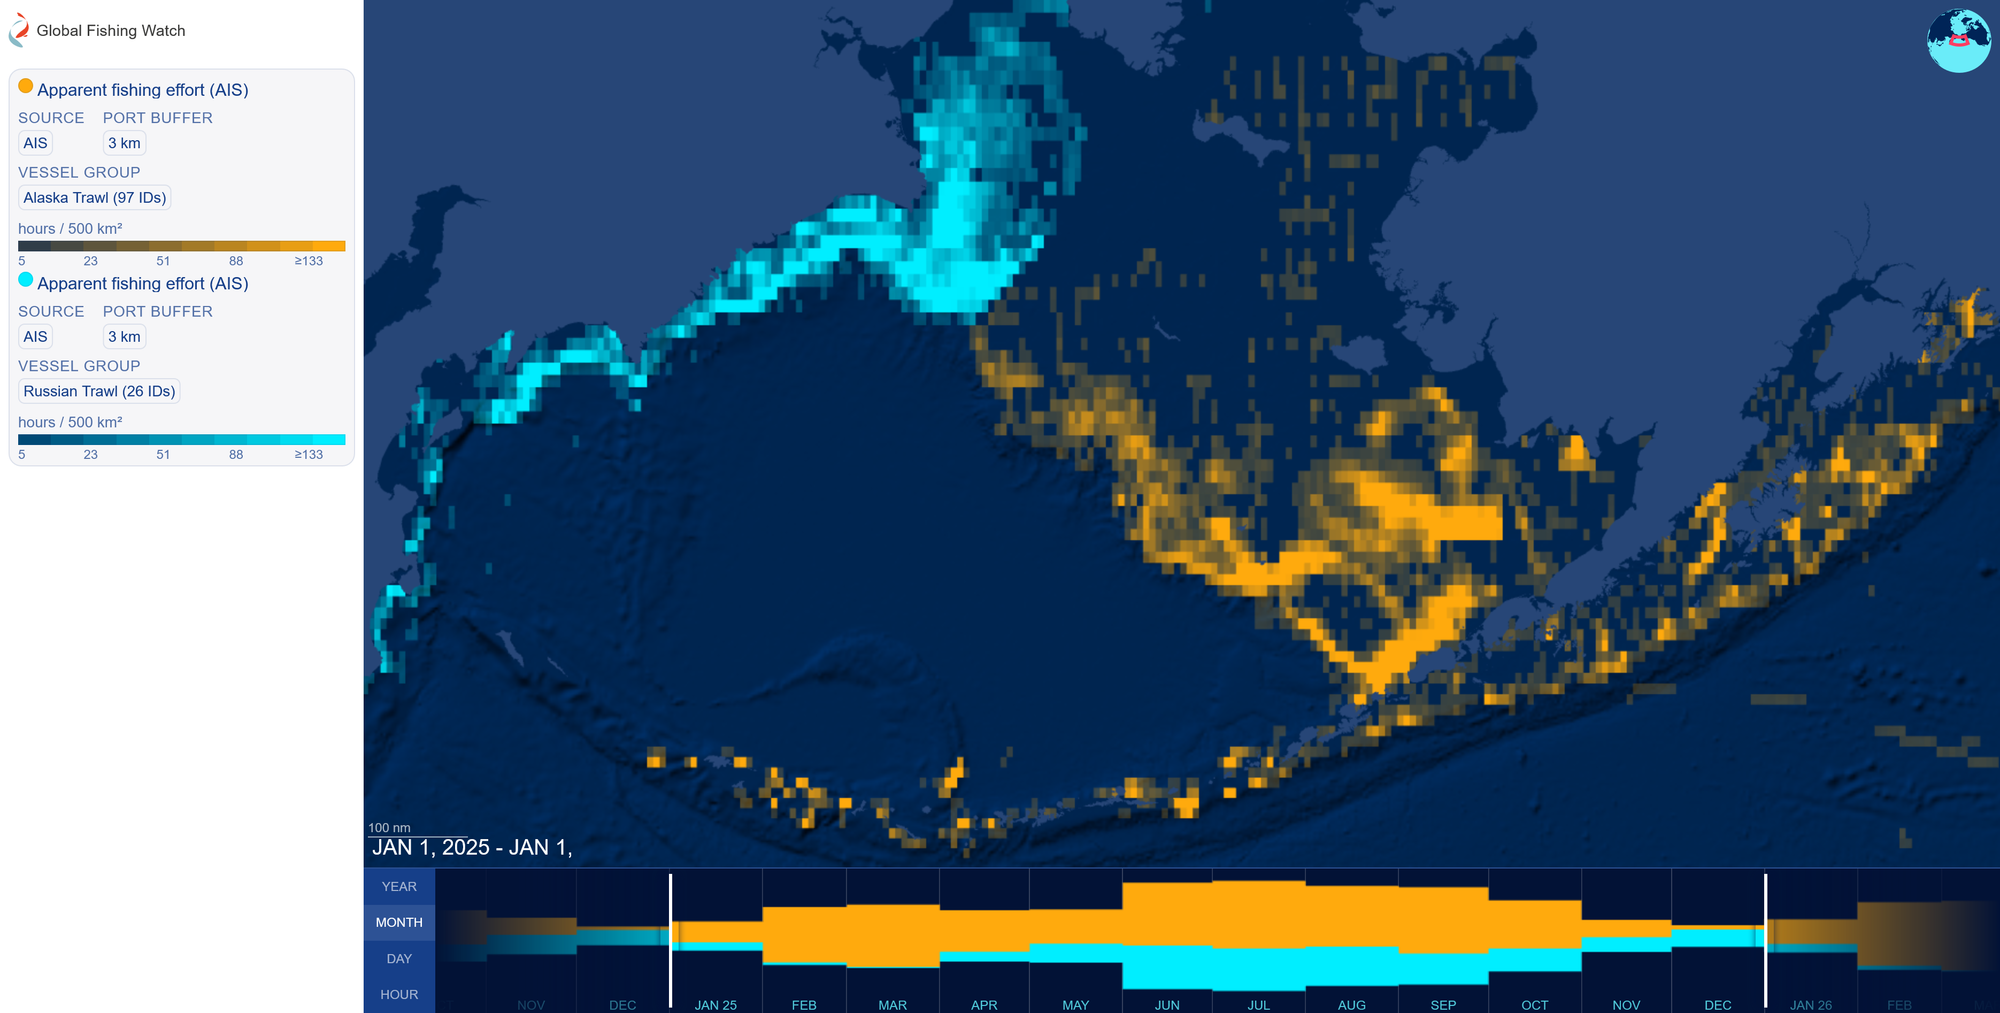
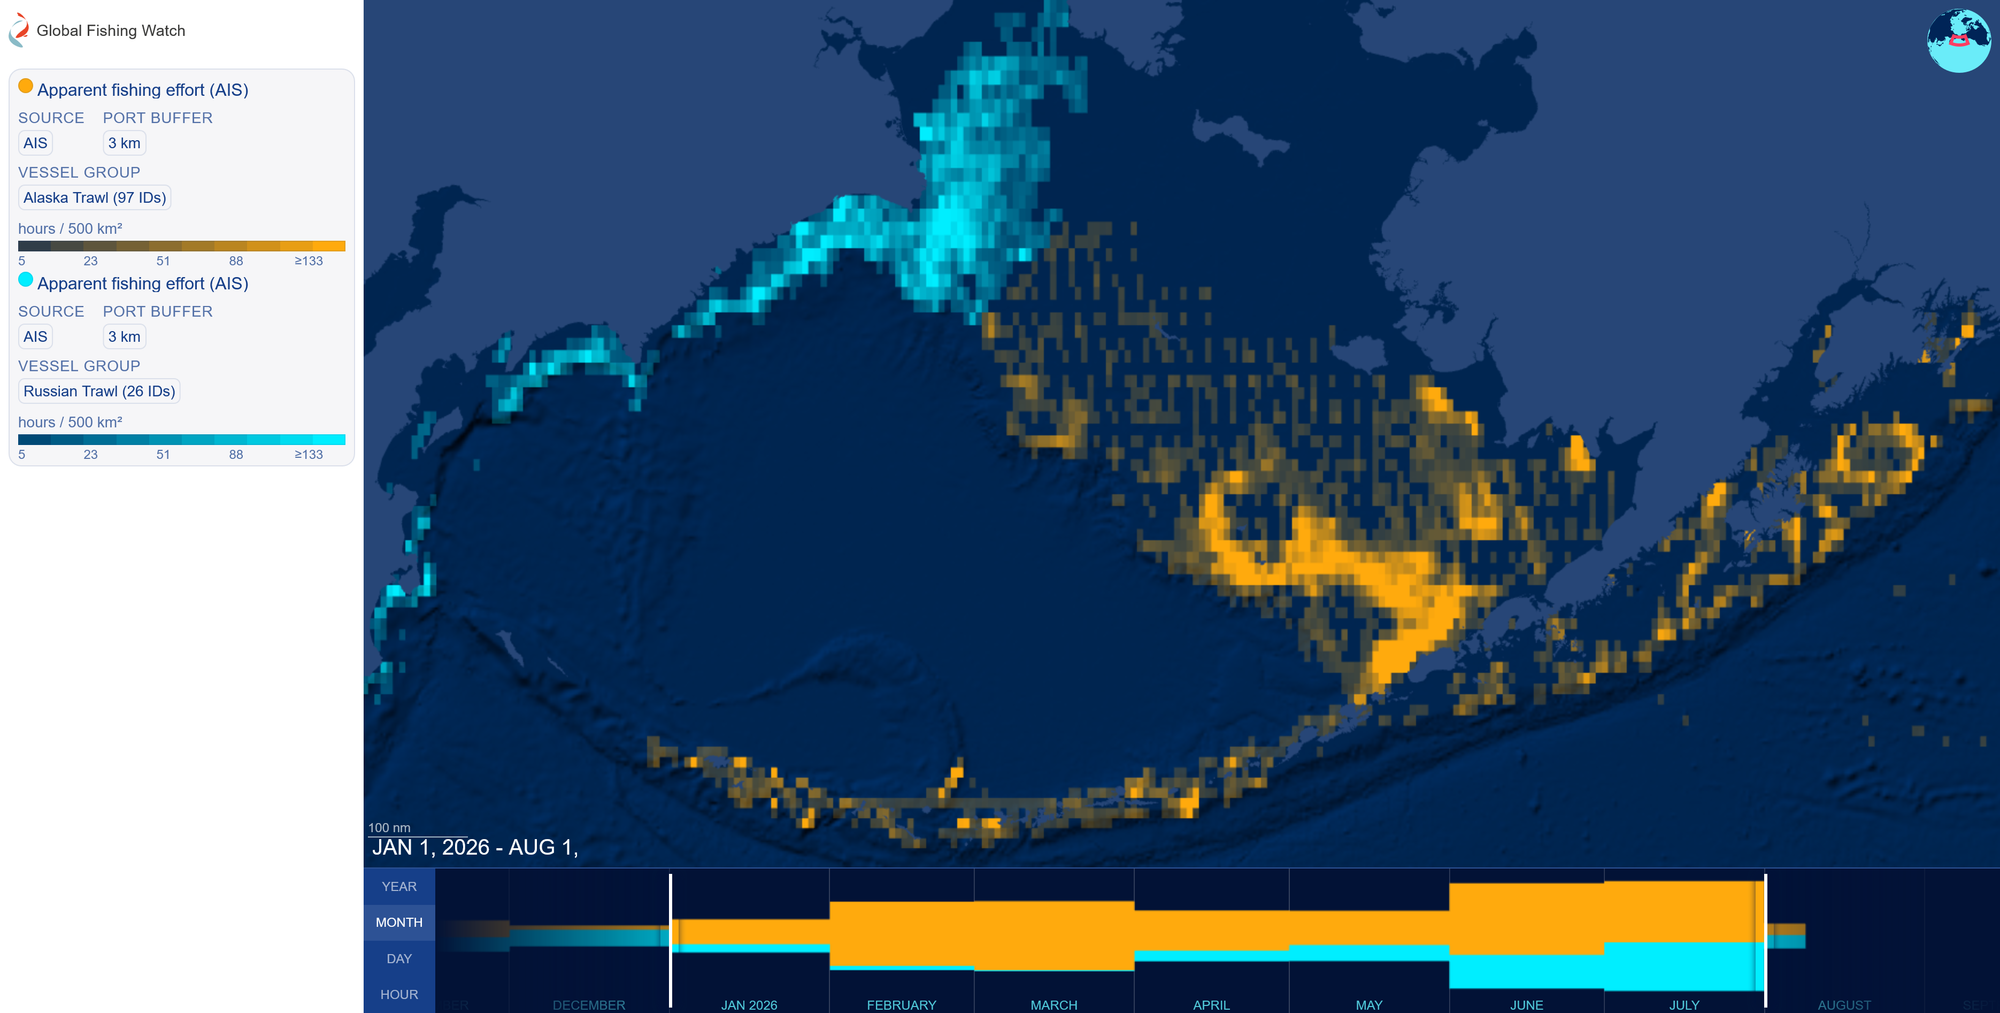
Each of these images depicts one year of trawl fishing effort in the Bering Sea; orange represents US fleet, blue represents Russian fleet. Brighter tones indicate more fishing hours. As you can see, coverage changes year by year but much of the <100m shelf is accessed intensively by the year-round trawl fishery. The two conspicuously unfished areas that look like the negative space in an "8" are the Pribolof Islands closure area to the north and the Chum Salmon Savings Area to the south.
Taken together, all of those years combine to produce this picture of the footprint of the trawl fishery:
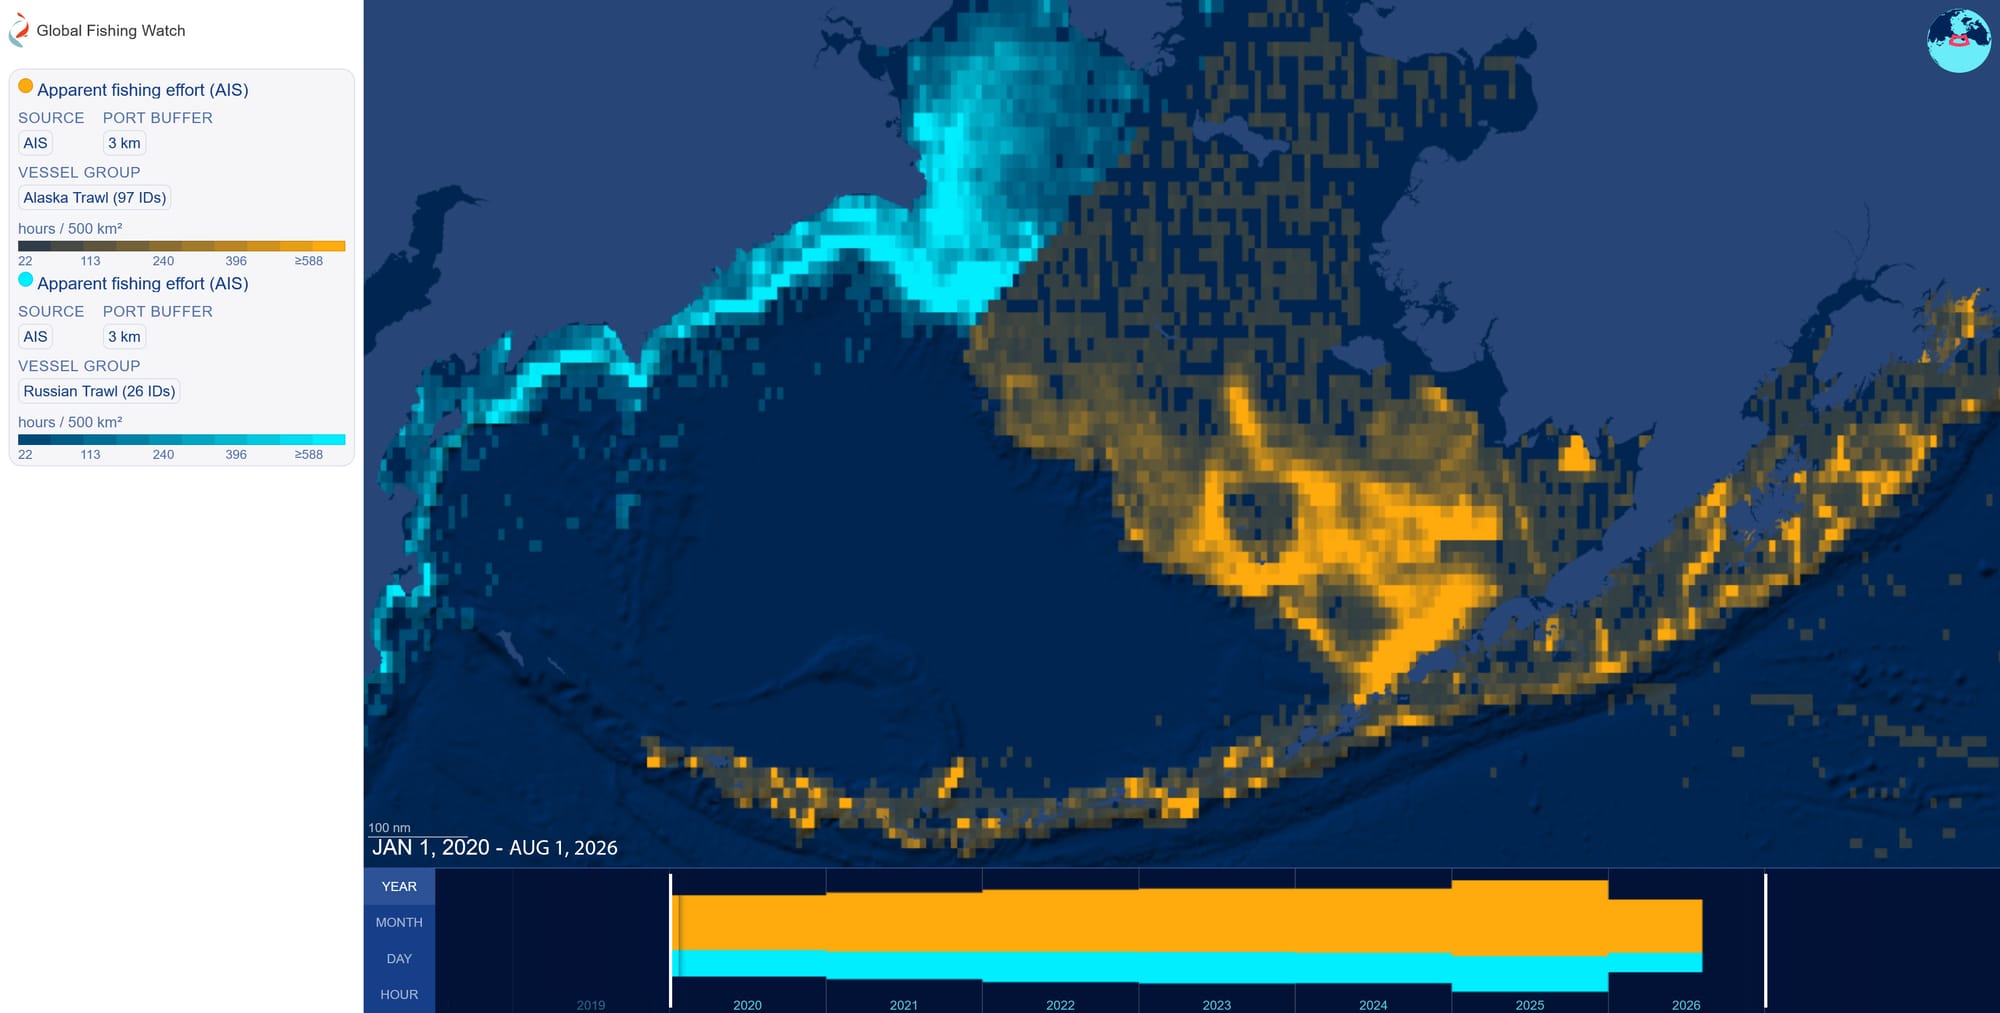
Compare that with the far-fetched factoid that some members of the trawl industry presented in an op-ed to readers of the Anchorage Daily News back in June: "The reality is that the “footprint” of the pollock fishery is incredibly small: Less than 1.2% of the Bering Sea and less than 0.7% of the Gulf of Alaska are trawled, and they are essentially the same areas that have been trawled since the 1940s". We can see from the above that far more than 1.2% of the Bering Sea is trawled - perhaps they left out the words "per day" - and any comparison to the 1940's is beyond absurd on any basis.
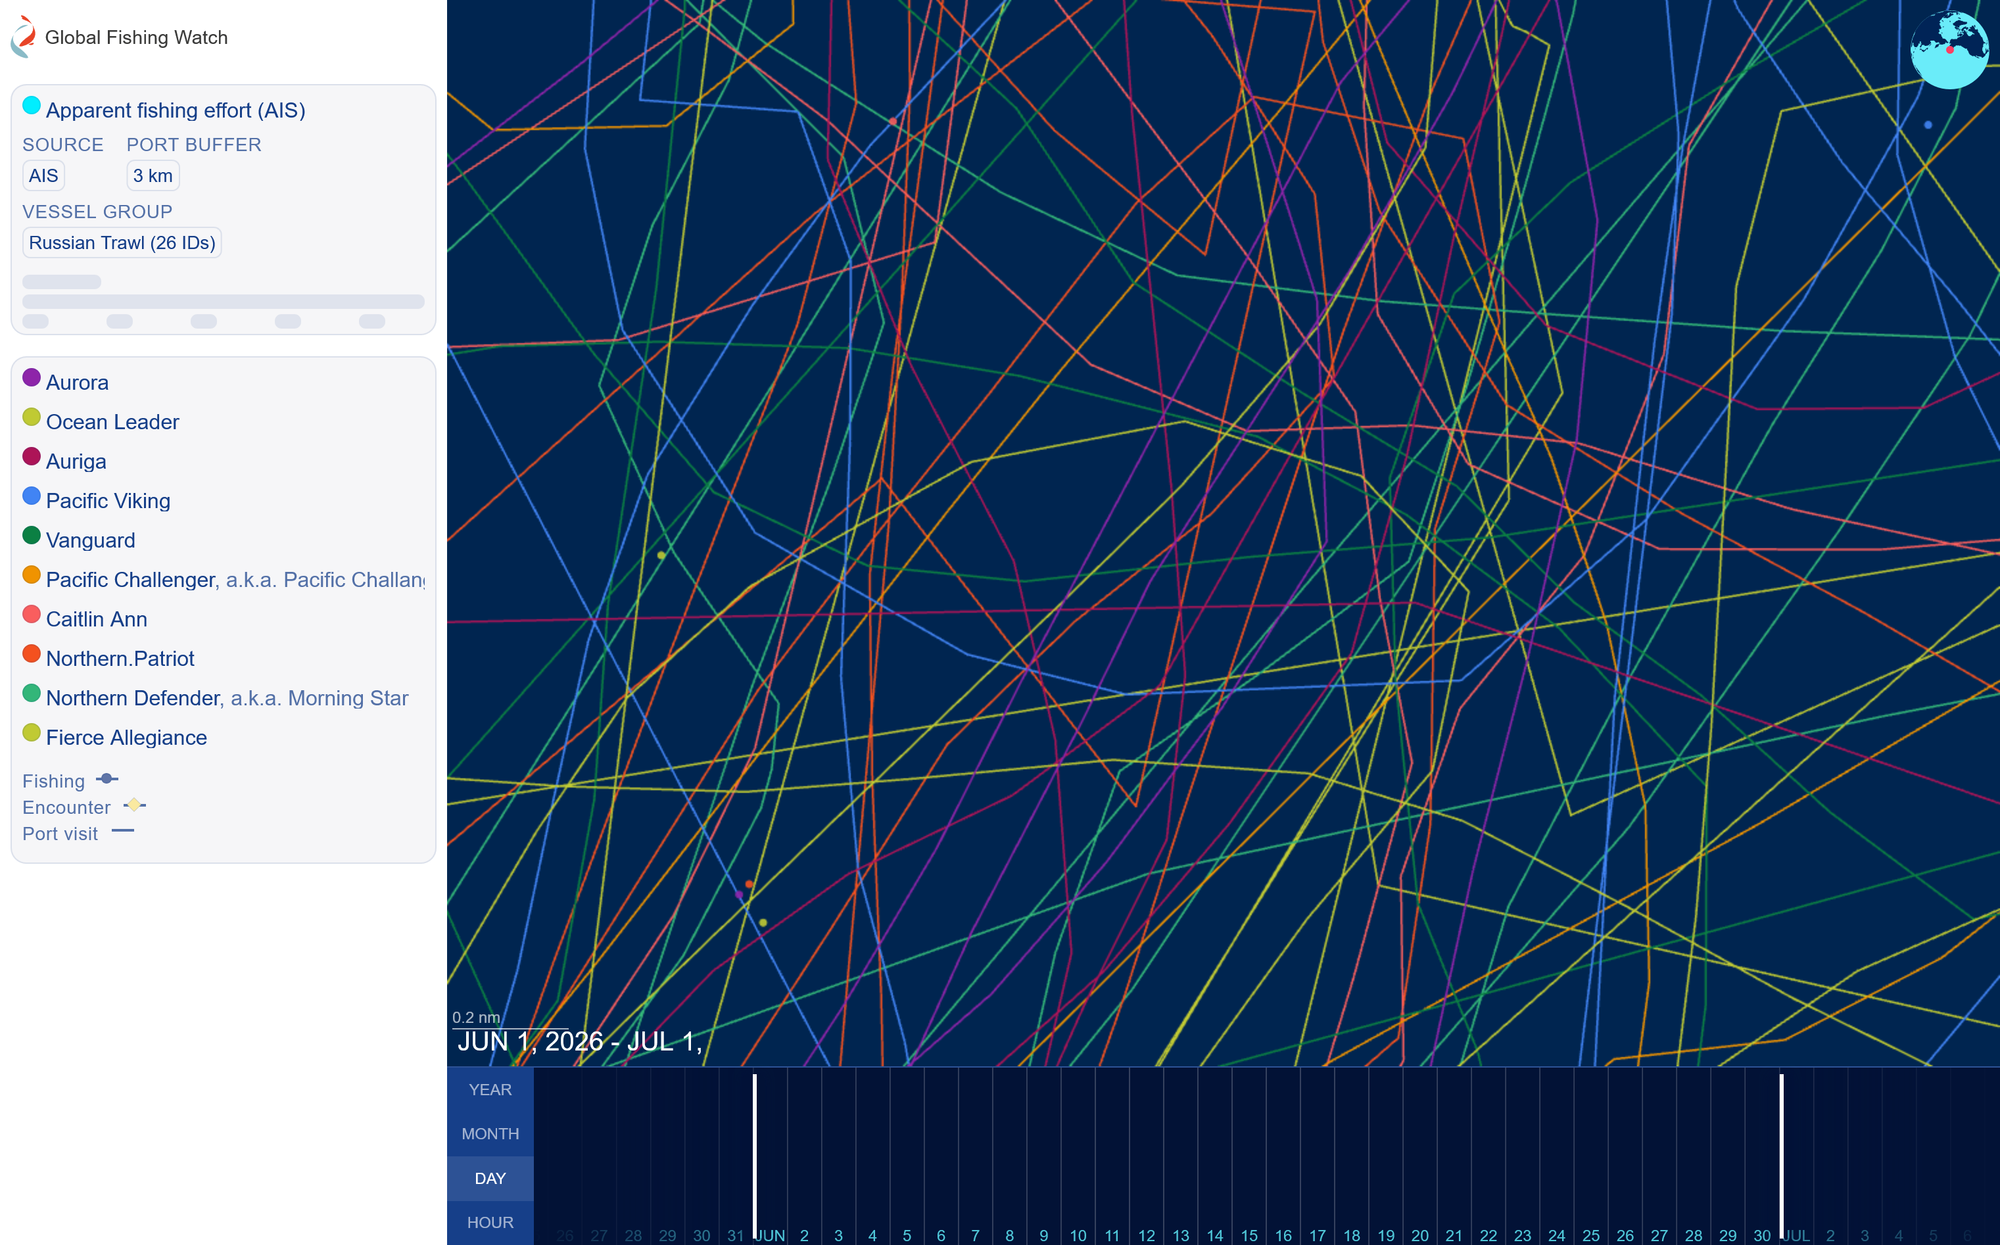
To give you a picture of what some of those bring orange areas look like at a closer scale, I'll hone in on just one month - June 2026 - in just one ~6 sq mile area, just north of Unimak Island, and I'll identify (non-exhaustively) 10 trawlers that fished that area that month, and you'll see how thickly they're criss-crossing the area, each time pulling a net with a mouth the size of a hockey rink behind. Here it is:
Next I'll zoom out so you can see the same ten boats in the same month in an area encompassing a few hundred square miles:
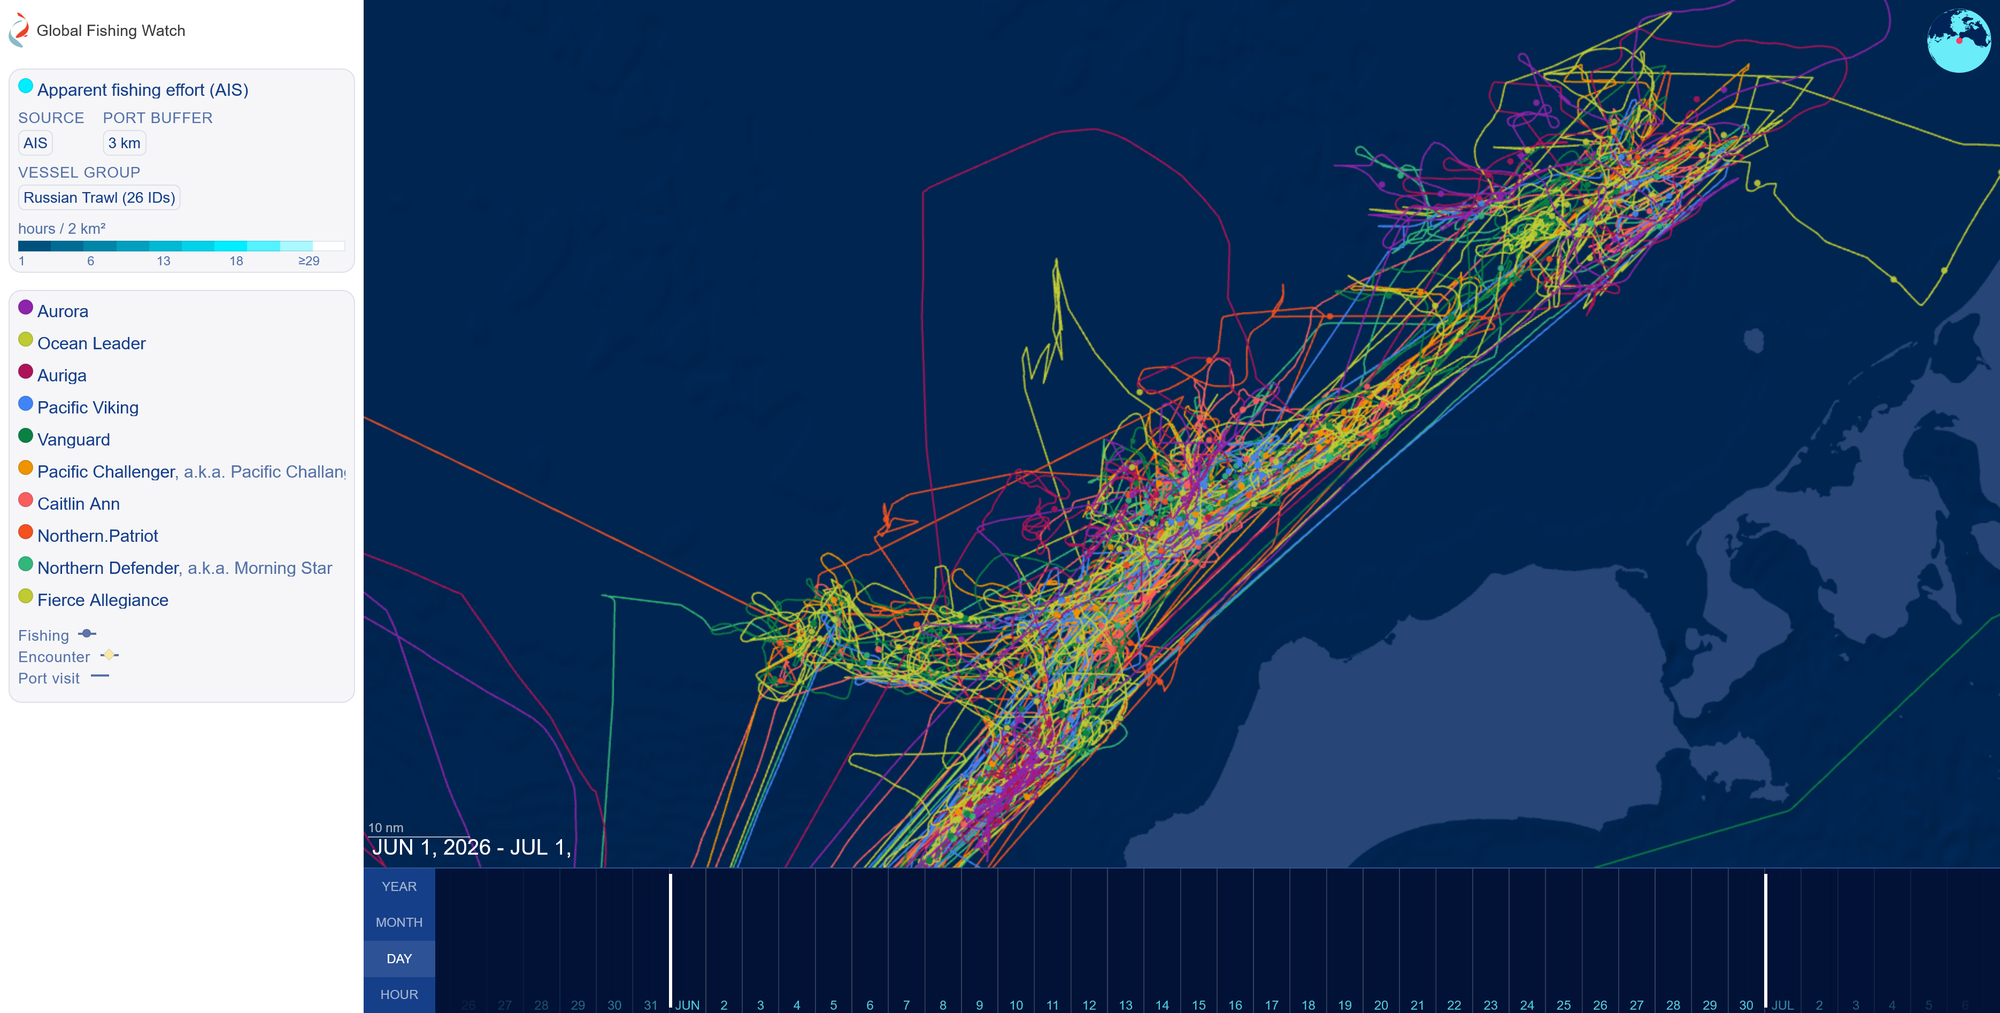
Finally, here's those same 10 boats except now their tracks are shown for all of 2026 through the end of July, and in an area encompassing a few thousand square miles north of the Aleutians. If I included more boats (and there are a lot more boats plying these areas), the whole thing would just appear as a wall of color, but hopefully this gives you a sense of the density and scale of their effect:
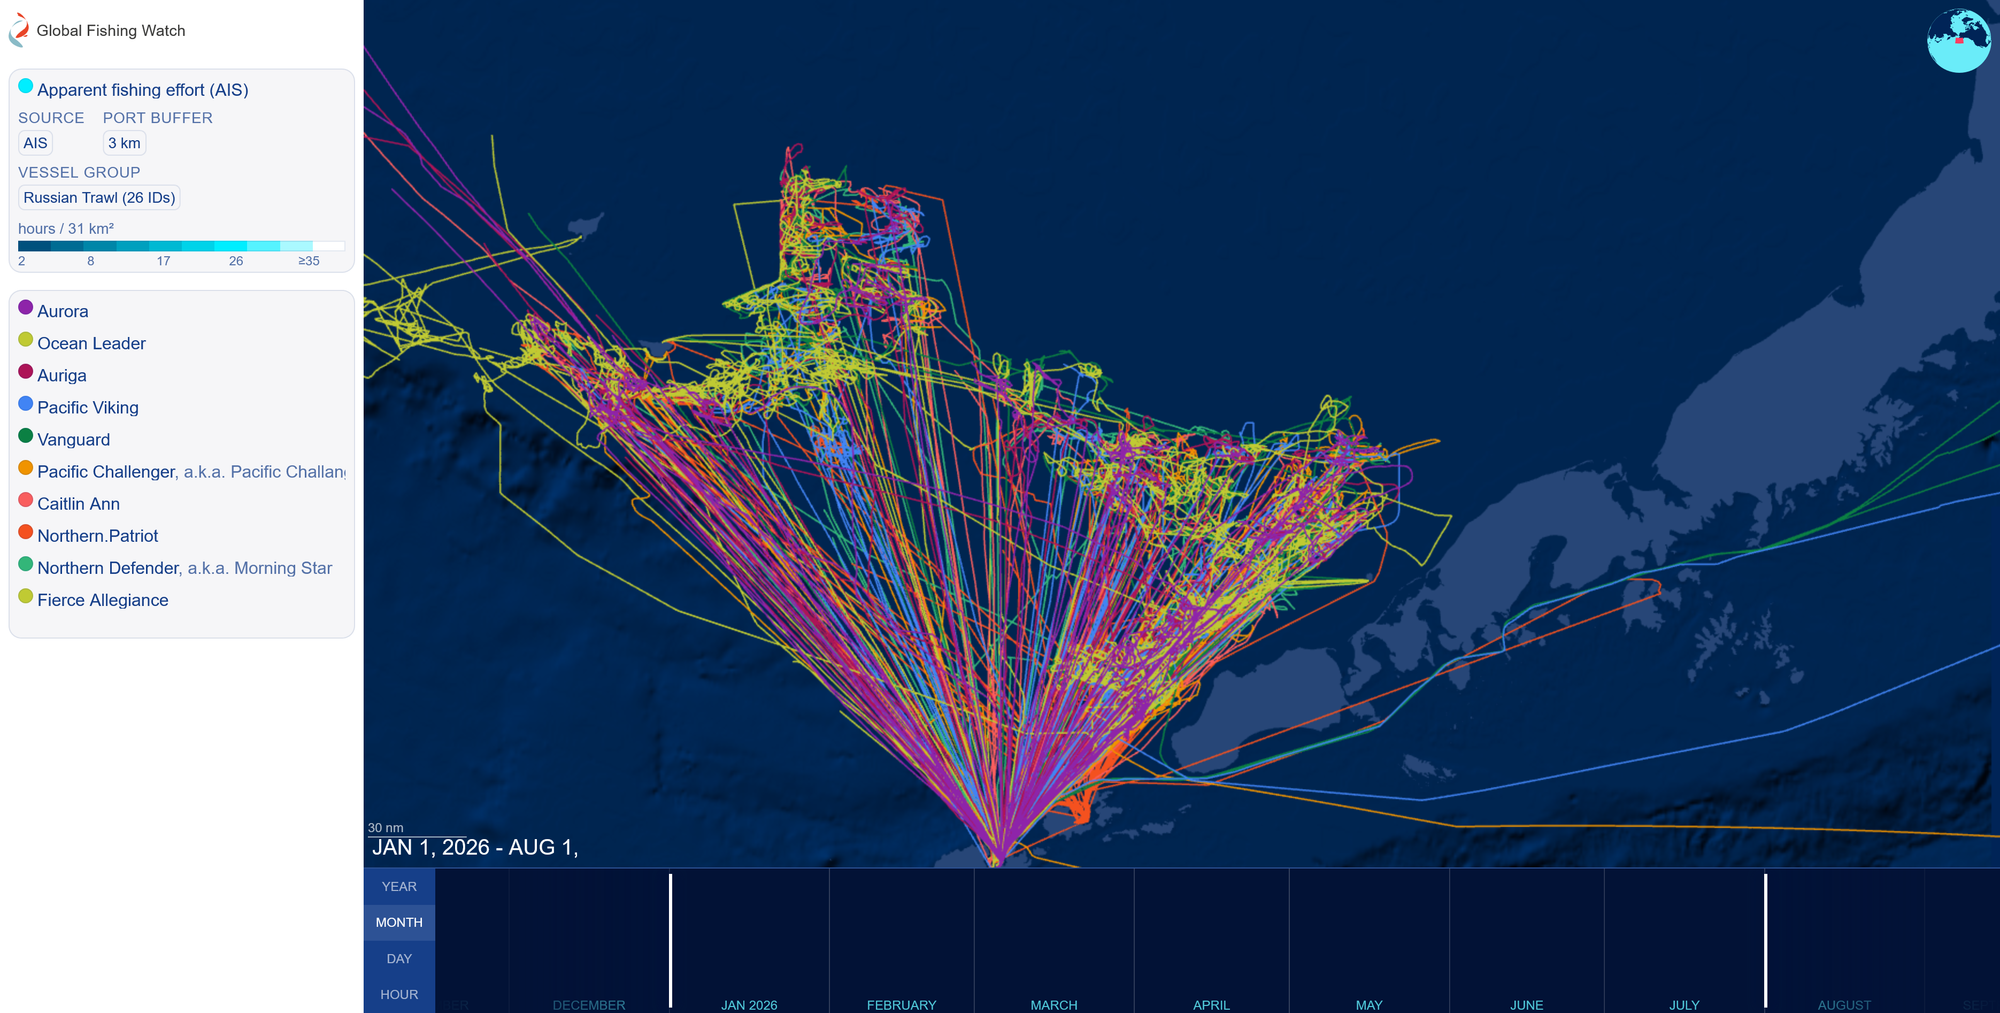
I find the intensity of this fishery absolutely staggering. This year, the allocation of Walleye pollock to the trawl fleet was 1,389,500 metric tons. At 2lbs per fish, that's 1.5 billion pollock. A lot else gets caught up in the hunt, including the salmon that the people of the Yukon River are counting on. Shouldn't happen. Alaska, get yourselves a good governor.
I hope everybody in Alaska considers voting for JKT, and if not him then another candidate who knows that they need to interfere with the marauding trawl industry. One of the platform pieces he establishes in the video above is that it is up to the Governor to appoint 6 members to the North Pacific Fisheries Management Council who might oppose the trawl fishery. It's gotta happen.
I'll leave it there for now, thanks for reading.