Herring Scrap 42: From the Surface to the Understory (Egg Counting in British Columbia)
The Penticton Herald ran a story on January 21, 2026 describing the conflict about herring in British Columbia in familiar terms:
The core issue driving the conflict is a growing divide over the science itself. Federal stock assessments classify BC herring as “healthy,” while Indigenous and conservation groups point to a long-term decline. Critics say DFO’s models rely on limited, recent data and overlook generations of traditional knowledge documenting consistently larger spawning runs.
“What is a good number? Is it the scientists that go out and do a test set and they say, oh, we found herring here, so there's lots or is it the elders in the First Nations who have been living off it for thousands of years?” [Kurt] Irwin [councillor for the Penelakut Tribe] said.
These sorts of statements have been showing up in newspaper articles for years now. My feeling is that when there are repeated indications that some form of western science seems hostile to or incompatible with Indigenous knowledge systems, it's a strong indicator that the science might be mistaking something. Seeing the above newspaper quote out of Penticton made me want to finally take a look at how Fisheries and Oceans Canada (DFO) spins up herring numbers in British Columbia. For long time readers, this will sound familiar to work I've done in/about Alaska, which I'll recap briefly.
In various other scraps (including 26, 27, 30, sort of 31, and others), I've outlined this thing that I've noticed about how herring and herring population trajectories are enumerated and modeled by the State of Alaska for the purposes of promoting a sac roe fishery in Sitka Sound. In brief, the State of Alaska presents statistical evidence showing that the spawning herring population in Sitka Sound has bloomed in the last several decades, amidst the ongoing commercial fishery. Since the commercial fishery is allowed to capture a regulated percentage of that population, growth in herring assessments results in an increase of fish that may be caught. What I noticed in the case of Sitka is that those assessments have steadily evolved, employing shifting methodologies and new technologies over time, in ways that result in higher assessment. The results of two-stage (stage 1: aerial/boat/foot surveys to locate herring spawn; stage 2: dive surveys a week or two later) herring spawn deposition surveys such as those conducted in Sitka and BC are bound to be responsive to changes in survey effort, extent, and intensity. A group of people will find more eggs if they look harder and have better searching tools and reference information. If this evolution isn't appropriately incorporated into modeling when managing different generations of population data, then the resulting statistical growth of herring populations may confuse methodological improvement in herring counting for real-world population increases. This has happened in Alaska. I think that the resulting confusion catalyses conflict about herring science by promoting a shifting baseline of herring population levels, (in)appropriate catch rates, and potential risk and harm.
I've wondered often if the story of herring assessment and baseline setting in British Columbia follows similar contours. I've sniffed around enough to understand that I'd have to work through DFOs extremely gnarly world of acronyms (it is appropriately confusing that the agency called Fisheries and Oceans Canada is officially acronymized as DFO) and freshly obfuscating terminology to do so, and I've been steadfast in avoiding the task for a few years now. But this week I got an itch to try, and already I'm inclined to believe that a very similar sort of distortion exists in the BC herring data as in Alaska.
This post evolved somewhat from an information gathering session on a set of questions, which, from broad to narrow go something like this: are egg deposition surveys at the heart of herring population modeling? Are historic spawning ground egg deposition surveys applied in contemporary modeling and baseline setting? How are different generations of egg deposition data collection folded into contemporary modeling and baseline-setting, how is difference in survey methodology accounted for, and what are some of the key assumptions underlying those choices? Is it clear that these choices are well developed and would stand up to scrutiny?
I'll try to retrace my steps through the Fisheries and Oceans Canada library, working backwards from a recent stock assessment into the history of the survey program. I'll start with the just-released Pacific herring 2025-2026: Integrated fisheries management plan summary - this is the final summary version of the document that I commented on a couple months ago in scrap #41 to no avail (the fishery proceeds apace). It outlines various considerations that go into the management of the fishery and reveals the model's conclusions about biomass as well as commercial allocations for each of BC's herring regions this year.
Here, for example, is what that document says about the herring fishing opportunity in Strait of Georgia (SoG) going into this season:
SOG: FSC [Food/Social/Ceremonial], Food and Bait, Special Use, and Roe herring opportunities (14% harvest rate) to a maximum of 14,390 tons. Assessment information for the Strait of Georgia is presented using the updated SISCAH modelling framework. Spawning biomass for 2026 is forecast to be 102,791 tons and above the LRP and USR (Upper Stock Reference) reference points. Based on a management procedure tuned to meet the conversative objective of maintaining the stock above the LRP with a high degree (>75%) degree of certainty, harvest rates of up to 14% will achieve this objective over the 15 year simulation period.
To rephrase: It is thought that 102,791 tons of herring will (try to) spawn in Strait of Georgia this year, of which 14% may be caught by the fishery. The model has determined the current population is healthy (which means it is above the "Upper Stock Reference") and that if 14% is taken this year, it is considered unlikely to result in the stock falling to critical levels (below the "Limit Reference Point") in the next 15 years.
These reference points are at the heart of DFO's approach to the precautionary approach (which they define as "being cautious when scientific knowledge is uncertain") - to fisheries management. As set out in A Fishery Decision-Making Framework Incorporating the Precautionary Approach, the way DFO accomplishes that for a given fishery is to establish a harvest strategy which:
"Identifies three stock status zones – healthy, cautious, and critical – according to upper stock and limit reference points; sets the removal rate at which fish may be harvested within each stock status zone; and adjusts the removal rate according to fish stock status variations (i.e., spawning stock biomass or another index/metric relevant to population productivity), based on pre-agreed decision rules."
Put another way, for each fishery, population levels are identified which mark the borders between critical and cautious (limit reference point), and between cautious and healthy (upper stock reference), with management approaches responsive to whichever of those population conditions applies. On the face of it, it may sound sensible. But it makes the setting of those reference points very important: set the reference point for "healthy" too low, for instance, and you might allow worry-free fishing on critical stocks.
I've listed several documents at the bottom that are part of understanding how those reference points are set, but I want to try to stay out of the weeds and so I'll just say a tiny bit about each.
First. There's a new model; similarly to the model used by Alaska in managing herring in Sitka, this is a "Statistical Catch at Age" herring model. They called it SISCAH. Notably, this new model applies different assumptions about herring mortality, and these assumptions do adjust (upwards) some of the hind-cast projections of historic herring populations. Take a look; for each of the five major herring population areas in BC, the population view of the prior model is in pink and the new model is in black:
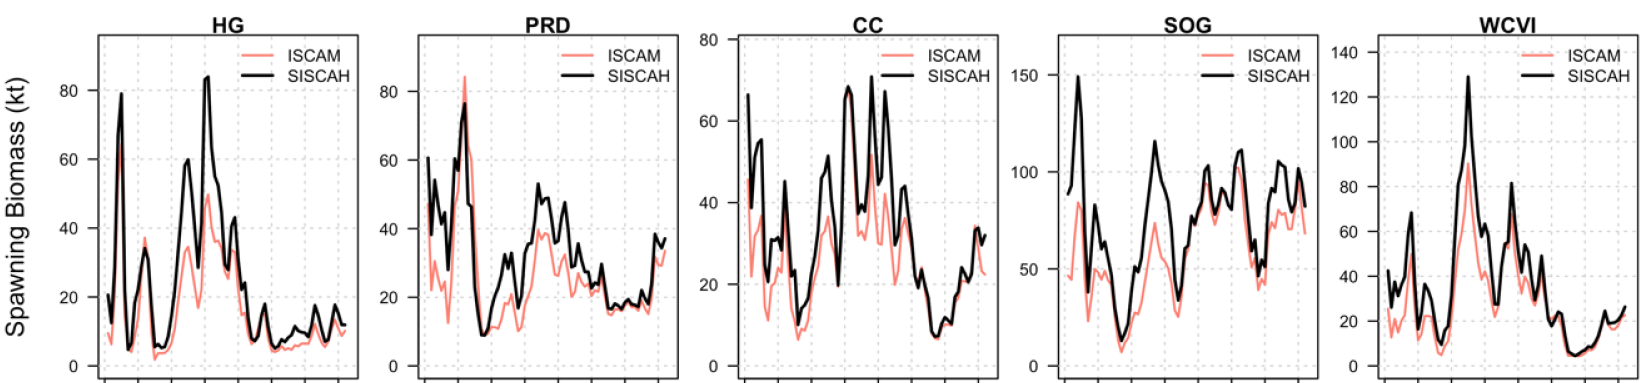
Given all that I've written about how impossibly low the numbers are in Alaska's hindcasts, it is interesting to see BC's historic herring populations grow in the eyes of the model. That's a change to the model itself - how it interprets the input data and makes assumptions about survival and mortality rates in particular. The new model doesn't, however, make any new meaningful change to address steady evolution in survey methodology (which is what much of the remainder of this post is about). Indeed, the model's suitability was described according to the following standard: "SISCAH was found to be acceptable as an operating model because it reproduced historical population trends as well as simulate future trends and observational data consistent with the historical dynamics." The new model was deemed suitable because it was able to fit to the existing historical data, assumptions, beliefs. My feeling is that this is a poor basis for suitability.
You can tell by reading the documentation of the model that the model is not designed to believe in any sort of herring abundance greater than that which our generations have witnessed lately. Here is a figure from the model documentation which shows a 250 year projection of herring at Haida Gwaii, absent commercial fishing. The chart begins in 1950, and then switches from historic trends to future projection at the vertical dotted line, projecting 200 years beyond 2022. The projection imagines 200 future years absent fishing pressure, and determines that the highs will still be fleeting and the long lows will be much like the conditions of the last few decades. It will get better than it is now, and it will get worse, but equilibrium will be something like it's been lately. I find it unimaginative:
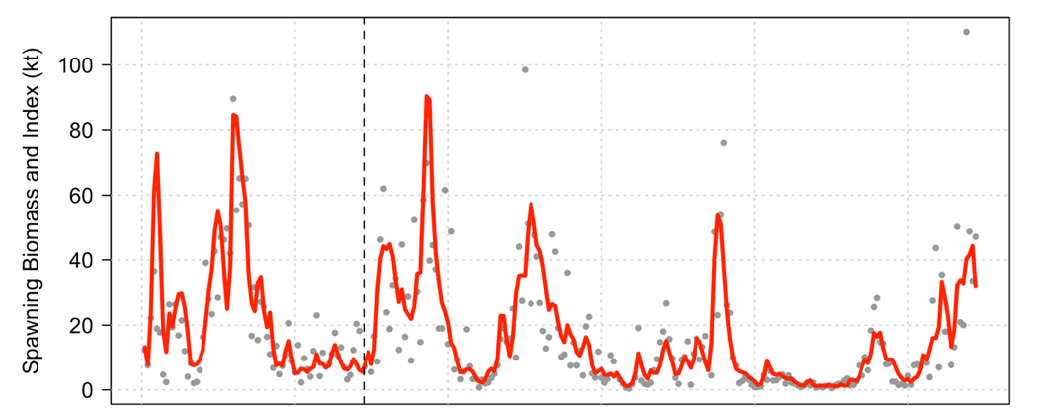
It's worse than unimaginative, though. These simulations (this projection has a twin in Alaska) are awful. They take ONE historical index ("a single spawn index that blends dive and surface survey designs") derived roughly from mixed methods field data, blend that data, and project it forward with mathemagical flair.
It is from this projection (and others like it, for the different management areas) that the Upper Stock Reference and Lower Stock Reference thresholds are defined. Those reference points are set (to paraphrase a couple of painful documents) in relation to an average of the spawning biomass extracted from that 200 year future projection. Those reference points will inform fisheries managers about whether the herring population state is critical, healthy, or somewhere in between, and they will manage accordingly. The old data provides the structure for an idealized future. It matters where the data informing that projection comes from, why, for whom.
So let's take a closer look at that "single spawn index that blends dive and surface survey designs" to better understand the (various) survey designs that the index represents, how the index has been constructed, and what it assumes.
Off we go to the Pacific Herring Spawn Index Data, which includes a technical report written in 2023 that describes the data. That report reveals the way that a range of historic spawning ground surveys are distilled down into a single index, and conceptualized as being the product of (just) two different fundamental surveying regimes since 1951 (data from before 1951 is deemed too inconsistent for use): predominantly surface surveys before 1988, and predominantly dive surveys ever since. I want to quote at length from two sections of the technical report where the survey evolution is described:
"The introduction of dive surveys in 1988 (Schweigert and Haegele 2021) makes it challenging to compare the spawn index between these two periods. For example, surface surveys are less accurate than dive surveys (section A.1) and spawn surveyors used subjective intensity categories instead of direct egg layer estimates until 1978 (section 3.1.1).
In addition, Pacific Herring spawn survey effort has been inconsistent over time due to variation in available resources and departmental priorities. For example, prior to 1988, surveyors often dedicated several months each year to spawn surveys: they used small vessels to search for spawn and the surface survey method to estimate egg deposition. Since 1988 surveyors primarily use aircraft to identify spawning activity and underwater SCUBA surveys to estimate egg deposition."
And later, this:
"From 1928 to 1978, surface spawn surveyors categorized spawn by subjective ‘intensity’ categories instead of direct egg layer estimates (Table 3). From 1928 to 1968 there were five intensity categories described as very light, light, medium, heavy, and very heavy (numbered 1 to 5, respectively). Starting in 1969 there were nine intensity categories; the change from five to nine categories was probably to accommodate the practice of reporting intermediate categories such as 3.5 (Hay and Kronlund 1987). Starting in 1979, spawn surveyors estimated the number of egg layers directly and continued to record intensity categories until 1981 to provide overlap between the two methods. In addition to recording the number of egg layers, surveyors sometimes recorded intensity after it was officially discontinued in 1981. We have converted spawn intensity observations in the Pacific Herring spawn survey database from five to nine categories for spawns that used the five category scale between 1951 and 1968. Thus, spawn data used for stock assessments are represented either by a nine-category intensity scale or a direct estimate of the number of egg layers."
And I want to focus on this conversion here: in order to normalize subjective impressions of spawning intensity gathered from 1951 through 1978 - that is to say, in order to make those impressions mathematically workable - DFO converted those intensity scales into egg layers as follows:
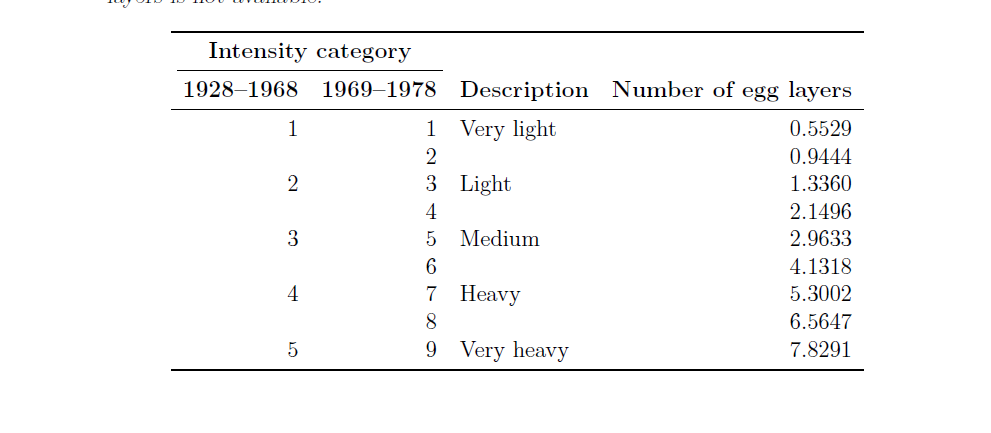
If somebody meant something other than 5.3 layers of eggs when they reported "heavy" or "level 4 intensity" spawning in 1953, that nuance is now gone from the data. And there is no uncertainty built into the model to help us (or the model) see or sense-make from that.
For a bit more context about this transitional time, I checked the Proceedings of the Fourth Pacific Coast Herring Workshop
October 7-8, 1981. For a few years there, all the scientists for BC and Alaska and Washington, Oregon, California, would get together and have these meetings where they'd swap notes as they experimented with approaches to herring management; the proceedings are a rich source for historic context about these herring assessment programs. In there, I found this account from Carl Haegele, a DFO scientist who was around for the transitional period between surface studies and dive studies, where he presents the impetus for the methodological transition: "In the early 1970's, attempts were made to derive direct estimates of spawners from [surface] survey data but there was little information available on the conversion of spawn survey data to numbers of eggs." Of the resulting investigations that commenced in 1975 and included the publication of a newly systematic manual for surface surveying, he wrote: "In the course of these investigations it was found that spawns extend deeper and are wider than had been suspected, and that the survey of deeper spawns is not amenable to grappling or other surface-based survey methods and that adequate data can only be collected by divers."
He's saying that early in the transition between methodologies, it was identified and understood that the surface spawning ground surveys had been underestimating the width and depth of the spawning grounds. I checked the spawn index to see how different the width readings were before that dive-informed awareness of the true width and depth of the spawning grounds and after. Reading Haegele's account left me feeling like the reformation of survey practice and the progression towards intensive dive surveying really kicked off in Canada in 1978 or 1979. I consulted the data to gather the mean for the period (1951-1977) before that change, as well as for the period afterwards.
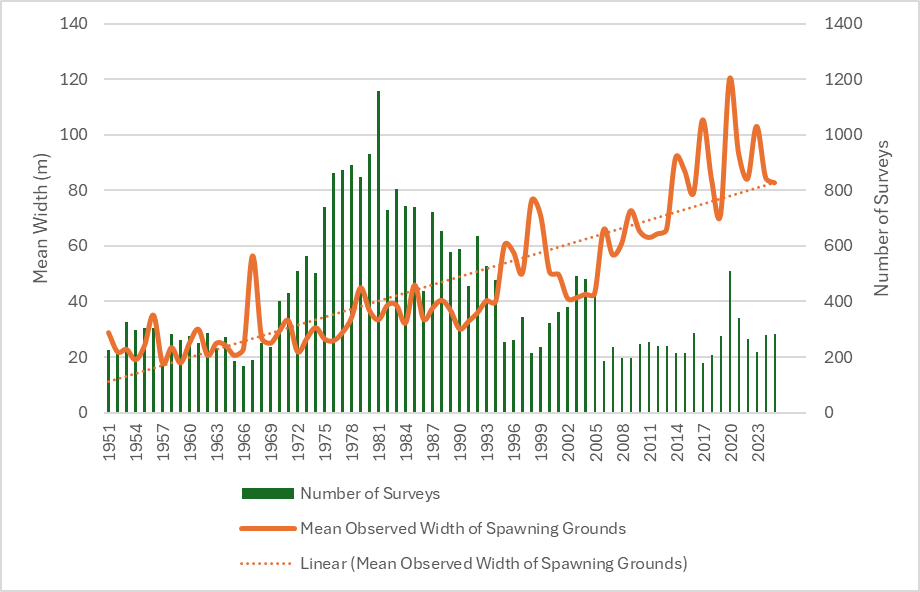
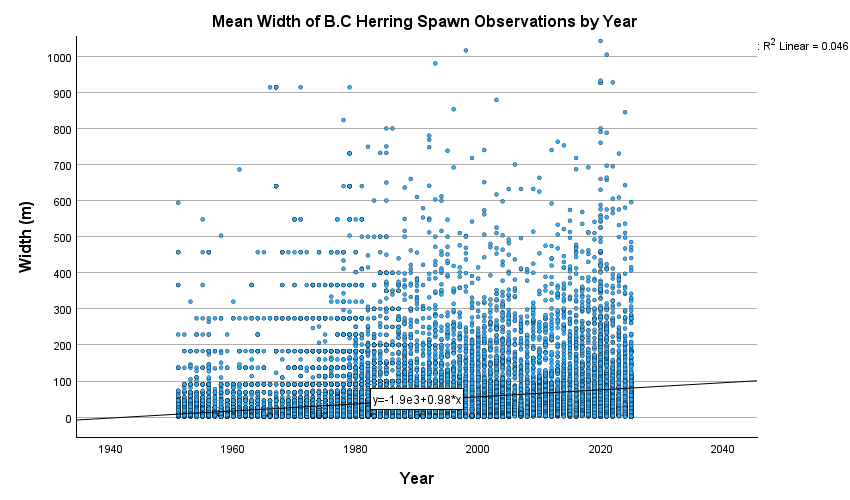
Hold onto your socks, people, it's a doozy: Between 1951 - 1978, the mean width of surface-based observations was 26.5 meters. For all years since 1988 - since the firm transition to dive surveys - the mean width of observations has been 55.6 meters. The number has only gone up with time; since 2010, the mean width has been 80.3m – triple the width of the 1951-1978 average. That's an incredible growth in a key parameter for determining biomass, a parameter that we know is responsive to honing methodology and building institutional knowledge about transect design & placement. It looks to me like all that change shows up in the math; width multiplies directly into the biomass calculation, and the modeling follows from there.
This chart shows (with orange line) the mean observed width of spawning grounds in DFO surveys for each year from 1951-2025. Green columns indicate the number of surveys (combined, dive and surface) each year.
You may wonder: How can we be sure that the older assessments were under-assessments of what was really there? The answer (gathered from this 1967 report) is almost shocking in its clarity: between 1955 and 1967, the commercial fishery caught 2,329,651 tons of herring. According to today's spawn index, only 1,180,981 tons of herring are accounted for by the cumulative survey index in the same time span. The catch in that period was twice as high as the cumulative herring spawn index data. No, this isn't possible. Yes, it is what the data says.
Today's population modeling and baseline setting does little to acknowledge just how underestimated the spawn index could be for those years. There are two adjustments that recent versions of the model made to distinguish between the two project phases; one provides a spawn index scaling parameter (q) which assumes that the dive survey era has identified the vast majority of eggs but which allows that the survey era missed more and applies a blanket scaling factor which acts on partial data; the other adjustments means that "spawn survey data post 1988 were assumed to be 1.166 times as precise as the pre-dive survey data (1951-1987)" (Cleary et al, 2019), meaning that they are weighted more heavily - trusted more - than the data from the surface surveys. But those adjustments do little to ameliorate the fabulous uncertainty of the data.
Meanwhile, any survey difference that existed for the years before 1988, or for the years after 1988, is erased by the modelling. In 1999, DFO Scientists Douglas Hay and Peter McCarter published a report (Distribution and timing of herring spawning in British Columbia (Hay & McCarter, 1999) wrestling with some curious signals in the data. They identified a paradox: "the results indicate that spawn has increased in most areas that have had fisheries (assessment areas) and decreased - or 'appeared' to decrease - in areas with no fisheries (non-assessment areas)." He identifies a possibility: "Any impact of declining survey effort in these areas, and other areas, will be to underestimate the spawn in recent years. If so, perhaps the spawning biomass was greater in these areas, and perhaps in all areas, than the data would indicate." The authors put it another way: "The intention of the present paper to describe spatial and temporal changes in spawn distribution may be partially confounded by the recent changes in spawn methods."
This is exactly the admission that Alaska doesn't make: when you're talking about counting fish eggs across a huge area, changes to the counting methods can obscure the meaning of the data. However, even though this article was published by Fisheries and Oceans Canada 27 years ago, the concerns expressed in the article still haven't been dealt with. In Canada, just as in Alaska, the deflated results of historic surveying practices are being used to envision a future of suppressed herring populations. DFO, like Alaska Dept of Fish and Game, doesn't deal with the implications of the acknowledgement made by Hay & McCarter for DFO in 1999.
I wanted to find a way to visualize the change in practice, and how much of an impact it had on the gathering of scientific data over time. I found that we can see it quite clearly if we take the 1951-2025 data from the Spawn Index and organize it according to ordinal date (where each day of the year is assigned a number from 1-366). The following graph shows every day (for days 1-212 of the year) on which spawning data exists in the Pacific Herring Spawn Index Data for each year going back to 1951. The two smaller images show the same data the same way, but focus on early-season (1-50) and late-season observation (121-212) dates to emphasize the temporal spawning range that was lost from the study following the shift to survey systematization in the late 1970's and intensive dive surveying in the mid-late 1980's.
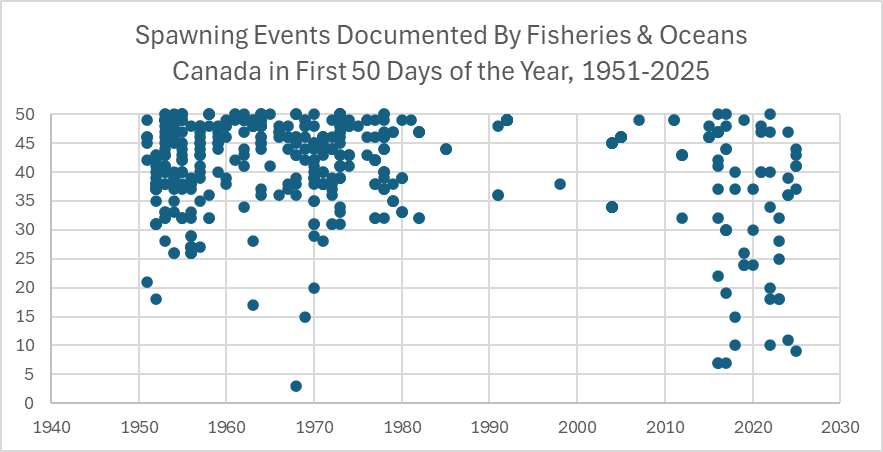
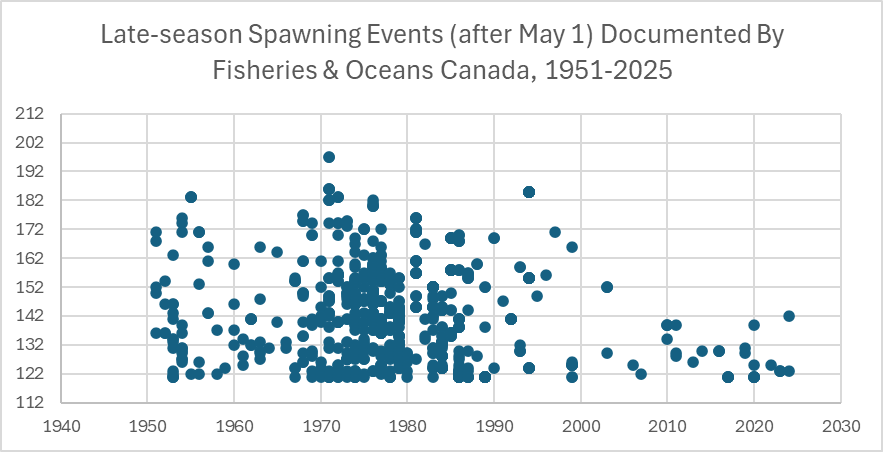
You can see quite clearly here that early- and late- season observations fall off a cliff in the 1980s until a bit of a resurgence in the last decade. The pattern does not, to my eyes, look like a herring-instigated pattern. Rather, it suggests that due to human factors, the data is likely ignorant of any early- or late- season herring doings that may have taken place in those decades.
If we pull apart the records of dive surveys from the records of surface surveys, the role of survey method in defining those dates becomes very apparent.
Here is the timing of surface surveys over time (1950-2025), followed by the timing of dive surveys (1985-2025):
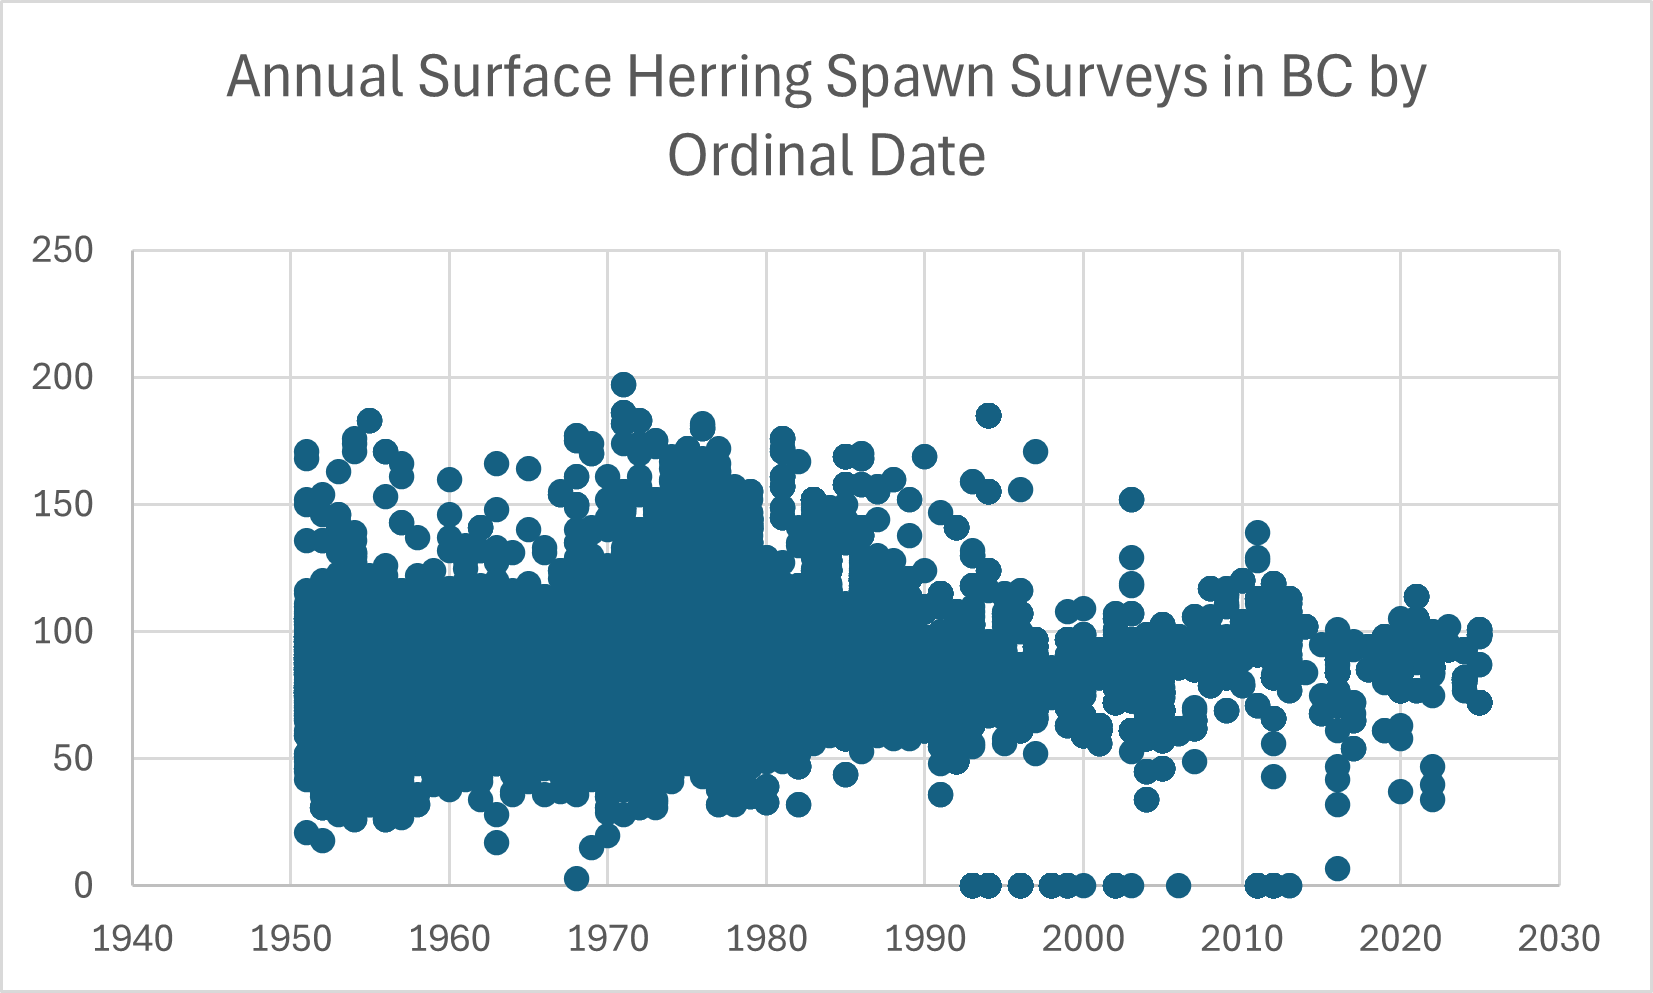
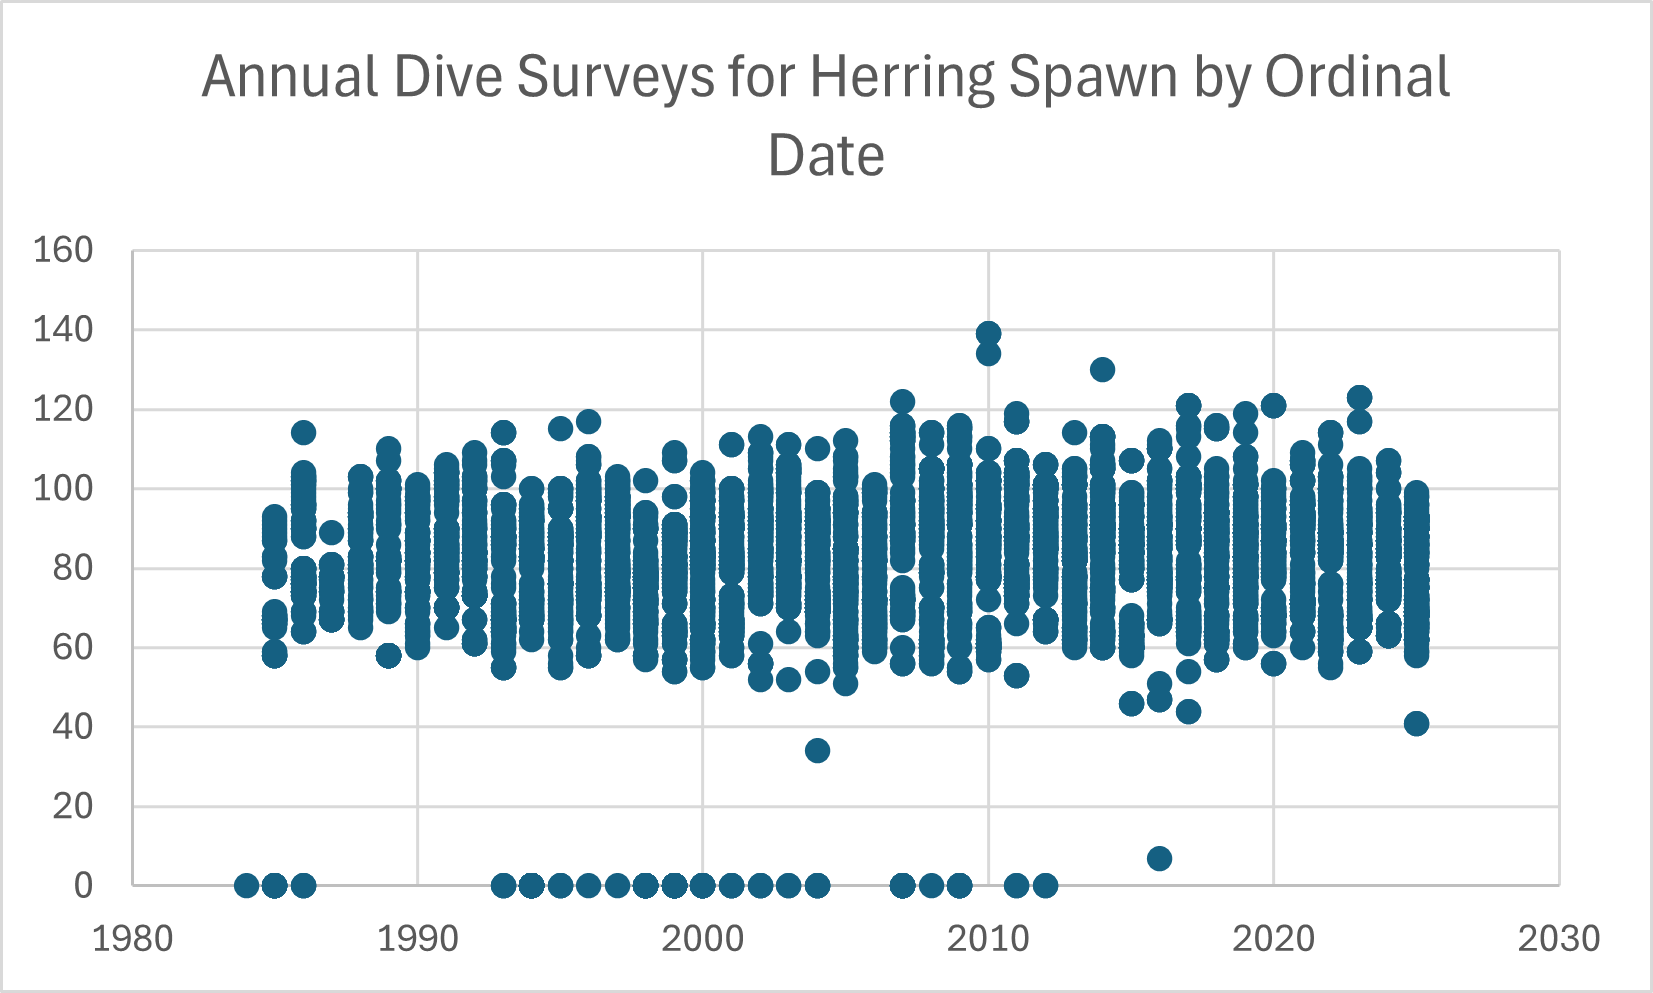
Note how orderly the dive survey (at right) timing is compared to the surface surveys (at left). As compared to the 150 days of spawning activity captured by survey efforts in the 1950's through 1970's, the annual dive surveys offer seven weeks of tightly packed documentation of herring spawning activity, year after year. Is the temporal record of herring spawning in BC in the dive survey era principally derived from the annual scheduling of boats and dive teams? I think that's what this looks like.
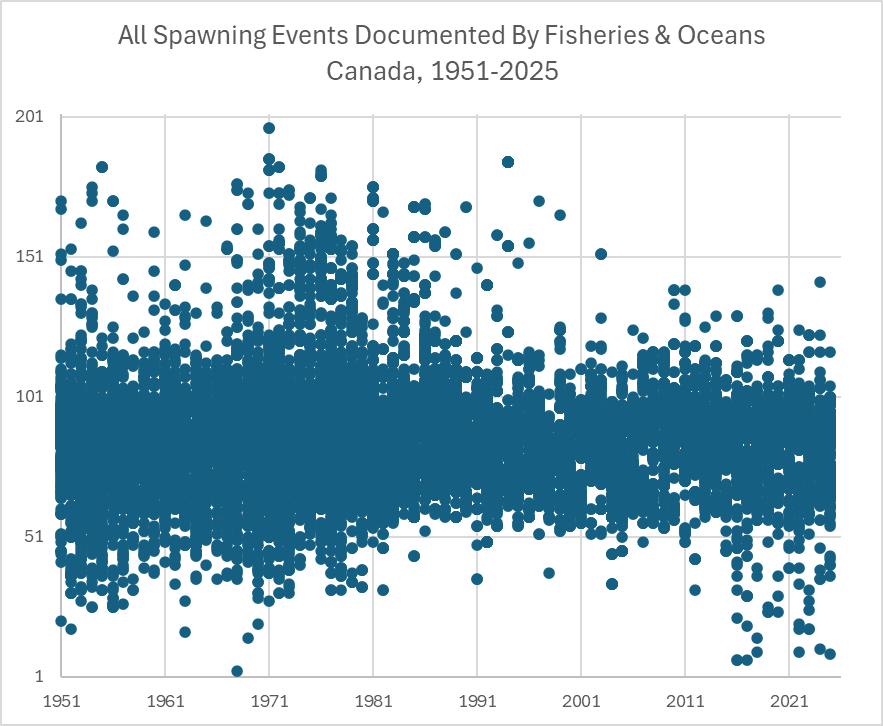
Finally, this scatter plot demonstrates the steady inflation of the mean width of BC herring spawn observations over time.
You get the idea: through all of the noise of the surveys, there's this clear signal that a key factor in the biomass calculations has been responsive to changes in survey methods.
DFO acknowledges in the reports that "The spawn survey is a presence only survey; thus the spawn index is a minimum estimate of spawning biomass" (Grinnell et at 2023). As opposed to an estimate of absolute biomass, a minimum estimate means that every season of herring surveying leaves an unseen remainder : spawn which occurred but is uncounted by the index.
The crucial point here is that we have every reason to believe that that unseen remainder has a trend: as methodology for thoroughly assessing herring abundance by counting eggs developed in BC, the unseen remainder has shrunk. It seems to me that in recent decades, that unseen remainder has served as a sort of latent statistical reserve, a rainy day fund of countable eggs. It may be that these days, that unseen remainder is less than ever before. Without uncounted wings, herring populations could surprise us with their irresilience to catch rates that may have seemed sustainable, to some, at some point.
In the DFO document Performance of management procedures for British Columbia Pacific Herring (Clupea pallasii) in the presence of model uncertainty : closing the gap between precautionary fisheries theory and practice, the authors write: "Previous evaluations indicated that the current herring management procedure (Cleary et al. 2010; Cox et al. 2019; and DFO 2015) might lack robustness across a wider range of hypotheses about Pacific Herring stock dynamics. The empirical data do not rule out the possibility that the current management procedure lacks robustness." Now that I've dug in, I find that the lack of robustness in the key index informing British Columbia's herring modeling almost extraordinary. If I hadn't encountered all of this already in learning about the evolution of the herring research program in Southeast Alaska, I wouldn't have believed it.
DFO is deploying a model which suppresses the possibility of abundance. It is doing so by interpreting historic survey results as if the surveys that produced those results were comparable, and using those survey results to set population baselines. This is a sweeping methodological vulnerability that DFO has apparently elected not to address for decades, and which is the long-developing problematic result of a shift towards systematizing - and indexing - survey efforts which began in the late 1970s. The benefit of not addressing it is that this approach has allowed several generations of commercial herring fishing to appear to have scientific basis in declaring stocks healthy enough to fish on. The cost is that it leads to conflict with knowledge systems that are incompatible with this vision, betrays the precautionary approach, and could contribute to collapse of fish populations.
From Victoria's Capital Daily, Nov 24, 2025, quoting Erik Pelkey, hereditary chief of the Tsawout of the W̱SÁNEĆ Nation:
“We showed them [DFO] how, as a result of their own studies, the herring communities that existed all along the coast started slowly dying off because the opening of the commercial fishery was erasing that territory,” [Erik] Pelkey [hereditary chief of the Tsawout of the ] said.
Pelkey said currently only a few small pockets of herring remain, which their community hope to protect and help recover. However, DFO presents data that shows otherwise. “They say, "That's not what our science is telling us,’” he said.
In British Columbia, just as in Alaska, low population states are being normalized by fisheries managers based on depressed historical data, and a depressing model of the future is the result. Whose evidence should inform the precautionary approach, anyhow?
Thanks for reading. Reach out via warmerworld@proton.me if you have thoughts/questions/comments/corrections.
Sources:
Benson, A.J., Cleary, J.S., Cox, S.P., Johnson, S., and Grinnell, M.H. 2023. Performance of management procedures for British Columbia Pacific Herring (Clupea pallasii) in the presence of model uncertainty: closing the gap between precautionary fisheries theory and practice. DFO Can. Sci. Advis. Sec. Res. Doc. 2022/048. viii + 70 p.
Cleary, J.S., Hawkshaw, S., Grinnell, M.H., and Grandin, C. 2019. Status of B.C. Pacific Herring (Clupea pallasii) in 2017 and forecasts for 2018. DFO Can. Sci. Advis. Sec. Res. Doc. 2018/028. v + 285 p.
Kronlund, A.R., Forrest, R.E., Cleary, J.S., and Grinnell, M.H. 2017. The selection and role of limit reference points for Pacifc Herring (Clupea pallasii) in British Columbia, Canada. DFO Can. Sci. Advis. Sec. Res. Doc. 2018/009. ix + 125p.
DFO. 2021b. Updated evaluation of management procedures for Pacifc Herring (Clupea pallasii) in the Strait of Georgia and the West Coast of Vancouver Island management areas of British Columbia. DFO Can. Sci. Advis. Sec. Sci. Resp. 2021/013.
DFO. 2023. Management Strategy Evaluation Update and Evaluation of Upper Stock Reference Point Options for Pacific Herring (Clupea pallasii) in British Columbia, Canada. DFO Can. Sci. Advis. Sec. Sci. Resp. 2023/002.
DFO. 2023. Application of a new modelling framework for the assessment of Pacific Herring (Clupea pallasii) major stocks and implementation in the management strategy evaluation process. DFO Can. Sci. Advis. Sec. Sci. Advis. Rep. 2023/040.
DFO. 2026. Pacific herring 2025-2026: Integrated fisheries management plan summary. https://www.pac.dfo-mpo.gc.ca/fm-gp/mplans/herring-hareng-ifmp-pgip-sm-eng.html#2
Forrest, R. E., Kronlund, A. R., Cleary, J. S., & Grinnell, M. H. (2023). An evidence-based approach for selecting a limit reference point for Pacific herring ( Clupea pallasii ) stocks in British Columbia, Canada. Canadian Journal of Fisheries and Aquatic Sciences, 80(7), 1071–1083. https://doi.org/10.1139/cjfas-2022-0168
Grinnell, M.H., Schweigert, J.F., Thompson, M., Hawkshaw, S., and Cleary, J.S.
2023. Calculating the spawn index for Pacific Herring (Clupea pallasii) in British
Columbia, Canada. Can. Tech. Rep. Fish. Aquat. Sci. 3489: viii + 45 p.
Haegele, C. Proceedings of the Fourth Pacific Coast Herring Workshop
October 7-8, 1981.
Hay, D., Mccarter, P. 1999. Distribution and timing of herring spawning in British Columbia. Canadian Stock Assessment Secretariat Research Document 99/14.